Driven by their passion for photography and social networking, Kevin Systrom and Mike Krieger launched Instagram in 2010. After 14 years and a 1 billion dollar acquisition, Instagram has amassed over 2 billion active users and secured its position as the world’s second most popular mobile app.
Whether you’re a business owner, content creator, or marketer, keeping up with Instagram and its latest developments is the edge you need to elevate your reach (and income) in 2024.
Keep reading to discover everything you need to know about Instagram’s users, revenue, growth, and more.
| Instagram Company Snapshot | |
|---|---|
| Launch date | October 2010 |
| Industry | Social Networking |
| CEO | Adam Mosseri |
| Headquarters | Menlo Park, Californnia |
| Parent Company | Meta |
Instagram is a free photo and video-sharing platform available to iPhone and Android users around the world. The app allows users to upload photos or videos, follow accounts they’re interested in, and like/comment on their posts.

Key Features
- Reels: Short, scrollable, vertical videos delivered via an algorithmic feed.
- Stories: Photos and videos that disappear after 24 hours.
- Feed: Photos or videos shared on users’ main timeline.
- Direct: An in-app private messaging feature that allows users to share messages, photos, and videos with one or more users.
- Search & Explore: A feature that shows users recommendations such as photos or reels, helping them discover new content and accounts to follow.
- Shopping: Features enabling users to shop via brand photos and videos.
Instagram Timeline
2010:
- In October, Instagram was officially released as an iOS app1, by founders Kevin Systrom and Mike Krieger.
- By December 2010, Instagram had over 1 million users.
2011:
- In January, Instagram added Hashtags2 to help users discover photos and each other.
- In September 2011, Instagram hit 10 million monthly active users and released Version 2.0 for iOS.
2012:
- In April, Instagram released an Android version of its app. This version was downloaded over one million times3 in less than 24 hours.
- Facebook acquired Instagram for $1 billion (23 million shares of its common stock4 and $300 million in cash).
2013:
- Photo tagging and video sharing were added to the app in the first half of the year.
- By December 2013, Advertising and Instagram Direct were added to the app.
2014:
- The company stepped up its advertising features, integrating a suite of basic analytics for businesses.
- It also launched a new series of editing tools5 allowing users to touch up their images and hit 300 million active users.
2015:
- Instagram launched Boomerang6
- Ads went global and Instagram doubled ad times for advertisers from 15 seconds to 30 seconds.
2016:
- Instagram surpassed 500 million users in June, The app also launched Stories in August7 to attract Snapchat users to the platform.
- Between October and December, Instagram launched commenting, live video, and its very first desktop client8.
2017:
- From February, users could share multiple photos and videos in a single post. Instagram also added the Paid Partnership tag to let users know when influencers were being paid to promote brands.
- By December, Instagram had surpassed 800 million users and rolled out recommended posts.
2018:
- Instagram hit the 1 billion user mark and launched IGTV9 to compete with YouTube
- In September 2018, founders Kevin Systrom and Mike Krieger resigned due to culture and product clashes with Facebook.
2019:
- Creator accounts were unveiled in April10, helping content creators take more control of their accounts.
- Instagram also earned over $20 billion in ad revenues11, surpassing YouTube.
2020:
- Instagram launched Shops12 as a way for users to buy products from business pages.
- In August, Reels were introduced as a TikTok rival13.
2021:
- Instagram dropped the IGTV tab and rolled out the Shop tab globally14.
- The app also increased the length of reels to 60 seconds and released reels ads globally.
2022:
- Instagram increased the length of reels to 60 seconds in February and 90 seconds15 in June.
- In September 2022, the Irish Data Protection Commission (DPC) fined Instagram 405 million Euros16 for violating the General Data Protection Regulation (GDPR) regarding the processing of children’s data.
2023:
- In February, Instagram announced it would be dropping the Instagram Shop tab17.
- In July, Instagram launched Threads18, an app aimed to rival X(formerly Twitter)
2024:
- In March, Instagram overtook TikTok as the world’s most downloaded app19 due to Reels.
- As of 24 Apr 2024, Instagram will only support shops with checkout enabled20, forcing users to sell directly on the platform instead of their own ecommerce sites.
Instagram Company Statistics
As of March 2024, Instagram has over 10000 employees, according to its LinkedIn profile.
This represents a massive jump from the 13 employees it had when it was first acquired21 by Facebook in 2012.
The average Instagram employee made $150,597 per year or $72 per hour22 as of March 2024.
Meanwhile, the estimated median salary was $155,581 or $74 per hour.
In 2023, Instagram had a brand value of $47 billion23, making it the 6th most valuable media brand worldwide.
This is up 40% from 2022 when the app’s brand value was $34 billion.
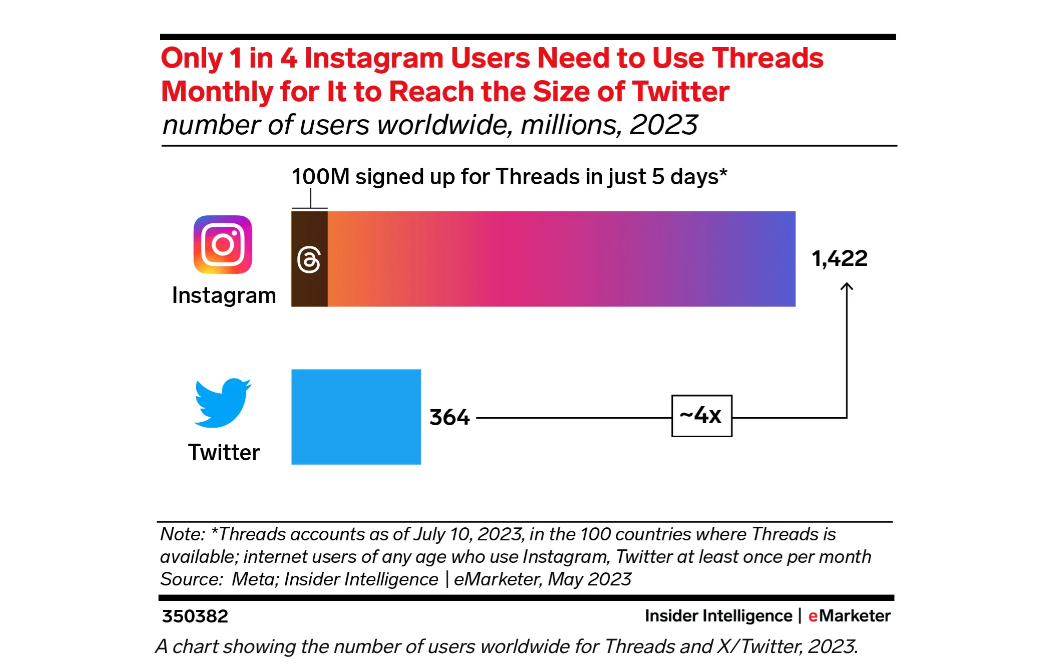
Instagram launched Threads in 2023, attracting 100 million users in just five days.
- More than 95 million posts were published on Threads in its first 24 hours.
- According to forecasts, Threads will have around 30 million active users in 2024, catching up with rival X which has 51 million users.
- Threads was ranked as the #1 free app on the App Store, and #10 on the Google Play store as of March 2024.
- Threads holds the record for reaching 1 million users in 1 hour. Instagram hit this milestone in 2,5 months.
Instagram Funding Statistics
In 2010, Instagram, then known as Burbn24, raised $500,000 in a seed round.
Baseline Ventures and Andreessen Horowitz participated in the funding.
In 2011, Instagram raised $7 million in Series A funding25.
Funding came from a variety of investors such as Benchmark Capital, Jack Dorsey, Chris Sacca (through his Lowercase Capital fund), and Quora’s Adam D’Angelo. The deal valued Instagram valued the app at $25 million.
In April 2012, Instagram raised $50 million in Series B funding26.
Just before its $1 billion acquisition by Facebook, Instagram closed a $50 million Series B round from Sequoia, Josh Kushner’s Thrive Capital, Greylock, and Benchmark at a $500 million valuation.
Instagram Growth Statistics
In October 2010, when Instagram first launched on iOS, over 25000 users registered on the day.
Within a week, the app had over 100,000 users and by December 2010, Instagram had 1 million users.
- In June 2011, Instagram announced that it had 5 million users.
- By September 2011 the app had over 10 million users.
- In January 2012 the app kicked off the year with 15 million users.
- By May 2012, active users exceeded 50 million.
In 2013, Instagram had over 110 million27 users.
By 2014, this figure had increased to 200 million, an 82% increase from the previous year.
This figure almost doubled the next year when Instagram hit 370 million users.
This was an impressive 85% increase year-over-year.
By 2017, Instagram had 700 million users.
This momentum continued, pushing users past 1 billion in 2018.
In 2020, there were close to 1.5 billion users on the photo-sharing platform.
By 2022, Instagram users approached the 2 billion mark.
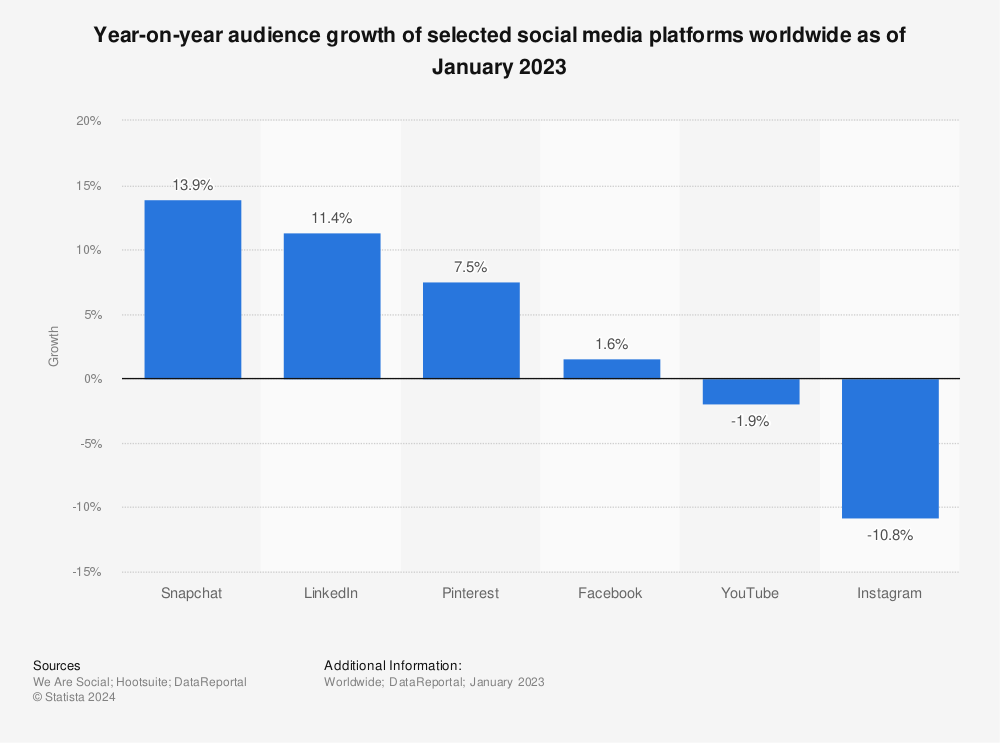
As of January 2023, Instagram's user growth was down 10.8%.
While Instagram had a negative growth rate of close to 11%, Snapchat, LinkedIn, and Pinterest, pulled ahead with growth rates of 14%, 11%, and 8% respectively, over the same period.
Instagram User Statistics
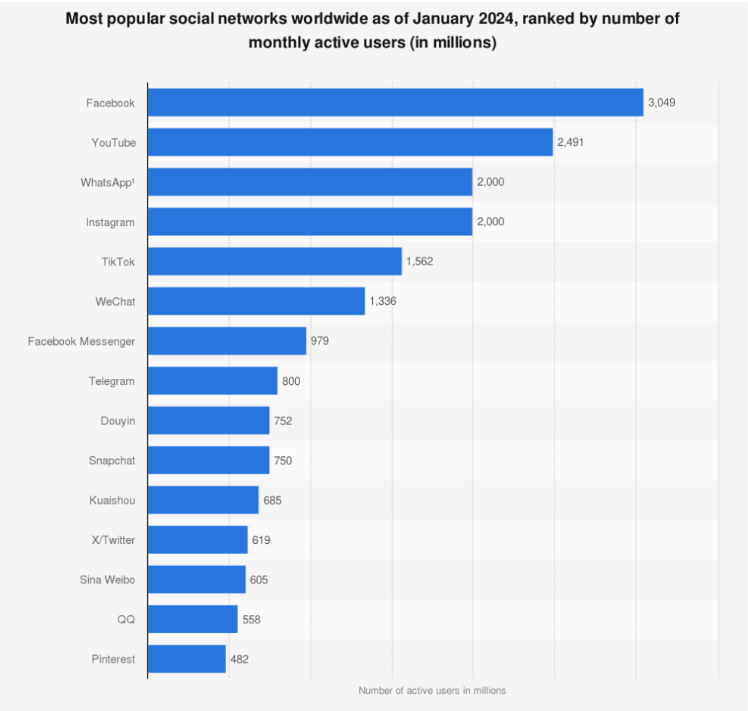
As of January 2024, Instagram had 2 billion monthly active users28. Making it the 4th largest social networking platform in the world behind:
- Facebook - 3.049 billion users
- Youtube - 2.491 billion users
- WhatsApp - 2 billion users
Internet users aged 16 to 64 voted Instagram as their favorite social media platform.
This was ahead of:
- Whatsapp (16%)
- Facebook (13%)
- WeChat (13%)
- TikTok (7%)
In addition, Instagram was most popular with users aged 16 to 24 and least popular with users aged 55 to 64.
As of April 2023, Instagram had over 1.6 billion users around the world29.
This means over 25% of all internet users aged 13 and above used Instagram.
- 32% or 518 million users on Instagram (the majority) were aged 18 to 24
- 30% or 489 million users were aged 25 to 34
- 15% or 246 million users were aged 35 to 44
Based on Instagram data, 50.6% of its global users were male as of April 2023.
Female users made up 49.4% of Instagram’s global users.
With over 326 million users, India was the country with the highest number of Instagram users as of April 2023.
The US came in second place with 169 million active users, and Brazil with over 132 million active users. This was followed by:
- Indonesia - 106 million users
- Turkey - 56 million users
- Japan - 55 million users
- Mexico - 44 million users
Instagram Advertising Statistics
As of 2024, over 2 million businesses and over 200 million marketers connect with users on Instagram.
Instagram will account for 9.8% of US digital ad spend30 in 2024.
Share is increasing, with Instagram set to account for 49.9% of Meta’s US revenues by 2025.
A Data Reportal report revealed the following audience overlaps as of January 2024:
- 81% of Instagram users were also on Facebook.
- 77% of Instagram users were also on YouTube.
- 77% of Instagram users were also on WhatsApp.
- 53% of Instagram users were also on TikTok.
76% of marketers are satisfied with the return on investment31 they receive from Instagram advertising.
While various factors such as competition, ad type industry, and more tend to affect how much advertisers pay for Instagram ads, it was found that on average, advertising on the platform was:
- Cost per click (CPC) - $0 - $0.25
- Cost per 100 impressions (CPM) - $0 - $4
- Cost per engagement - $0.03 - $0.08
In addition as of March 2024:
- 65% of businesses spent between $0.00 and $6.00 per 1000 impressions on Instagram ads.
- 59% spent between $0.00 and $0.75 per click on Instagram ads.
- 54% spent between $0.03 and $0.08 per engagement on Instagram ads.
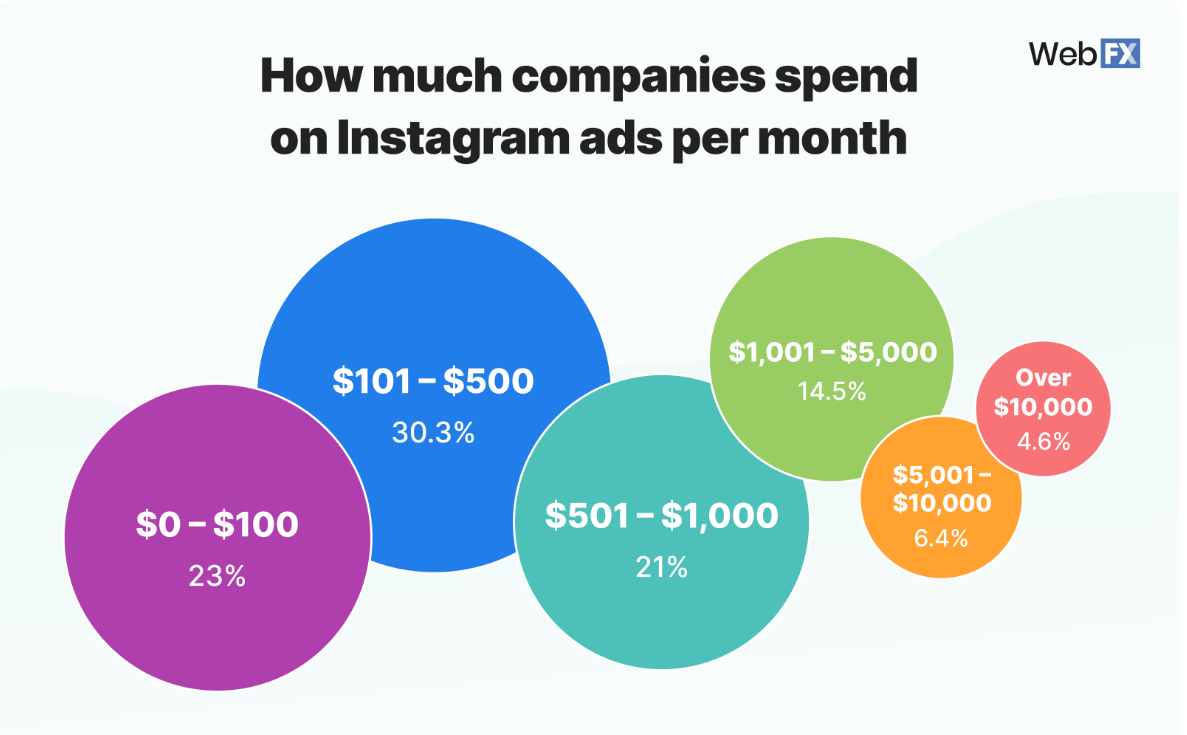
- 53% spent between $0.00 and $500 per month on Instagram ads
- 49% allocated up to 20% of their overall ad budgets to Instagram ads.
That same month, research32 found that business and creator profiles on Instagram had an organic reach rate of 14.26%.
Meanwhile, the average video view rate was 105% and the average growth rate was 1.3%.
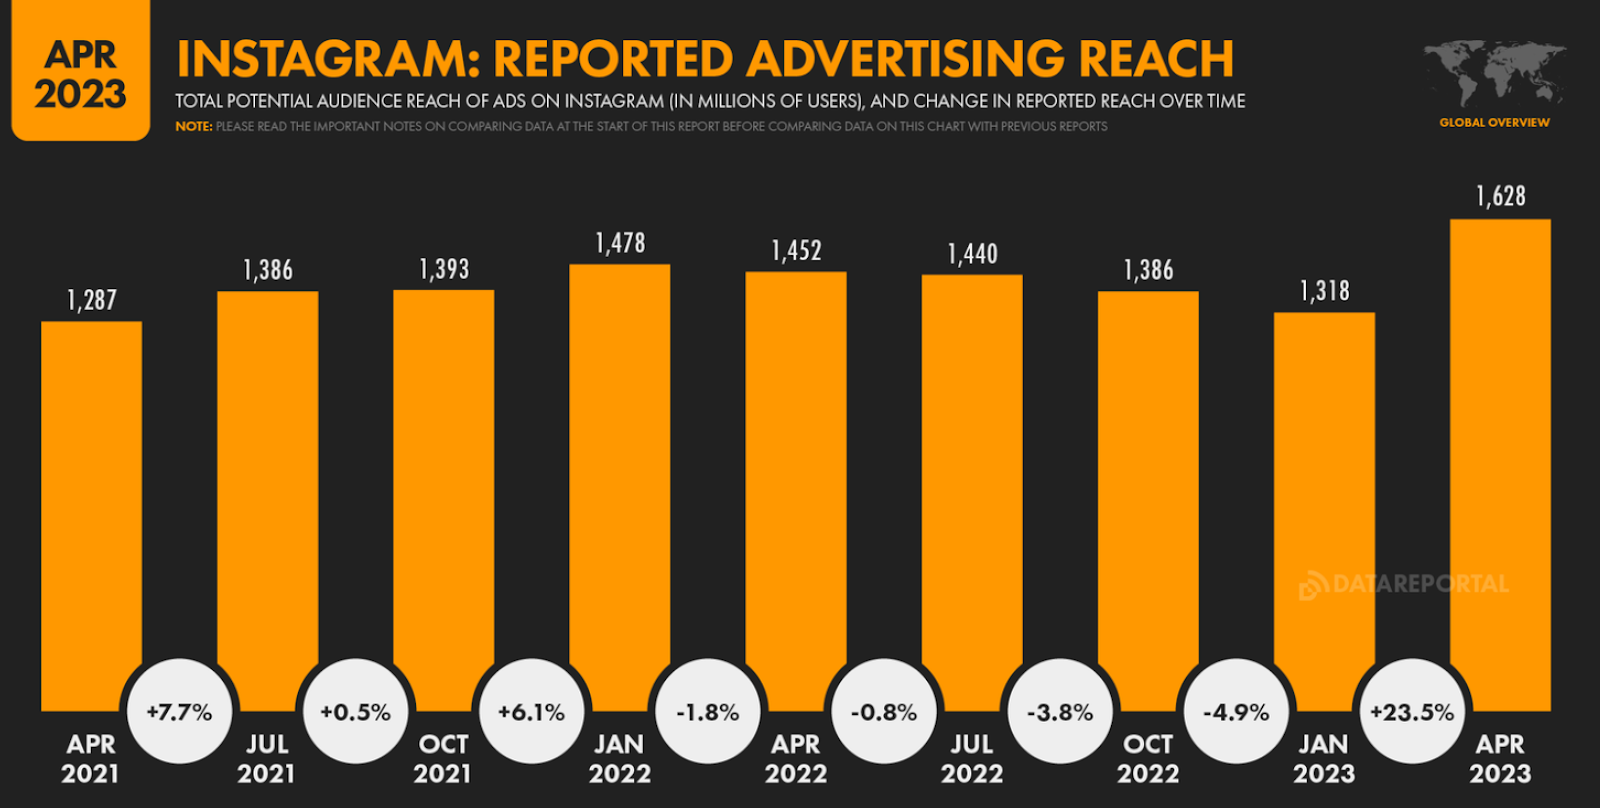
Instagram’s marketing reach grew by 20% in 202333.
In 2023, advertisers could reach 1.63 billion users on Instagram. This is 12.2% or 176 million more users than they could reach in 2022.
Brands added an average of 4.6 posts a week on Instagram34 in 2023.
With 15.6 posts per week, sports teams added the most posts to the platform, while media brands made 10 posts per week. Additionally:
- Retail brands posted 6.8 times per week.
- Fashion brands posted 6.4 times per week.
- Health and beauty brands posted 6.1 times per week.
Tech and software, food and beverage, and alcohol brands posted the least frequently with an average of 3 posts per week.
In 2022, 80% of global marketers used Instagram to advertise their businesses.
This made Instagram the second most popular social media network for advertising.
Instagram Revenue Statistics
Instagram generates revenue mainly from ads and in-app purchases such as:
- Instagram Badge - $4.99
- Meta Verified - $14.99
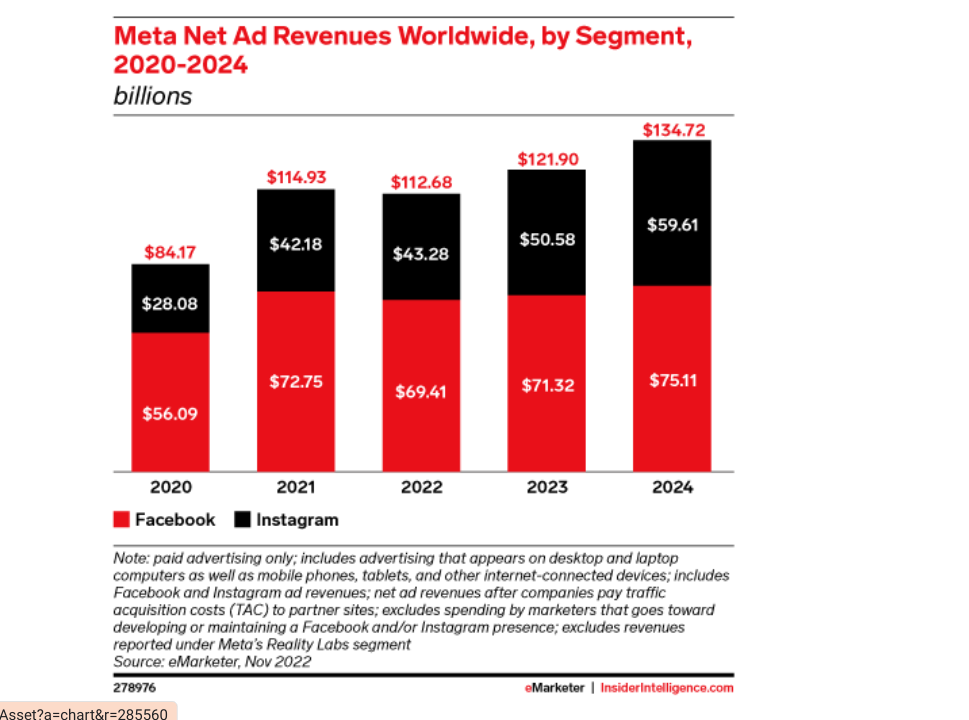
In 2024, Instagram will generate an estimated $59 billion35 in revenues.
This is up from $50 billion in 2023 and $43 billion in 2022. In 2021, Instagram ad revenues experienced an impressive 50% surge from $28 billion in 2020.
Instagram’s ad revenue per user will reach $43 in 2024.
This is up from $34 in 2022.
In 2023, Instagram generated revenue of $23 billion36 in the US.
According to estimates, this is anticipated to increase to $29 billion in 2025.
Instagram stories accounted for 27% of the platform’s ad revenues in 2023, up from 26% in 2022.
In coming years, ad spend on Instagram stories is expected to exceed that of in-feed ads.
Estimated Instagram Revenue: 2015 to 2023
| Year | Revenue in Billions |
|---|---|
| 2015 | 0.5 |
| 2016 | 2 |
| 2017 | 4 |
| 2018 | 10 |
| 2019 | 19 |
| 2020> | 27 |
| 2021 | 48 |
| 2022 | 51 |
| 2023 | 60 |
Instagram Engagement Statistics
As of January 2024, the majority (70%) of internet users aged 16 to 64 used Instagram to post and share photos or videos. Other popular activities included:
- Looking for funny or entertaining content - 65%
- Following or researching brands and products - 63%
- Messaging friends and family - 58%
- Keeping up with news and current events - 53%
The most used Instagram hashtag37 as of January 2024 was #love, used over 2.1 billion times.
This was followed by:
- #instagood - used 1.76 billion times.
- #instagram - used 1.22 billion times.
- #fashion - used 1.15 billion times.
- #photography - used 1.06 billion times
According to Meta, reels receive 140 billion plays across Facebook and Instagram each day.
Reels have not only helped Instagram gain market share over TikTok but they have also made it easier for brands to grow their community, hop on trends, and collaborate with creators.
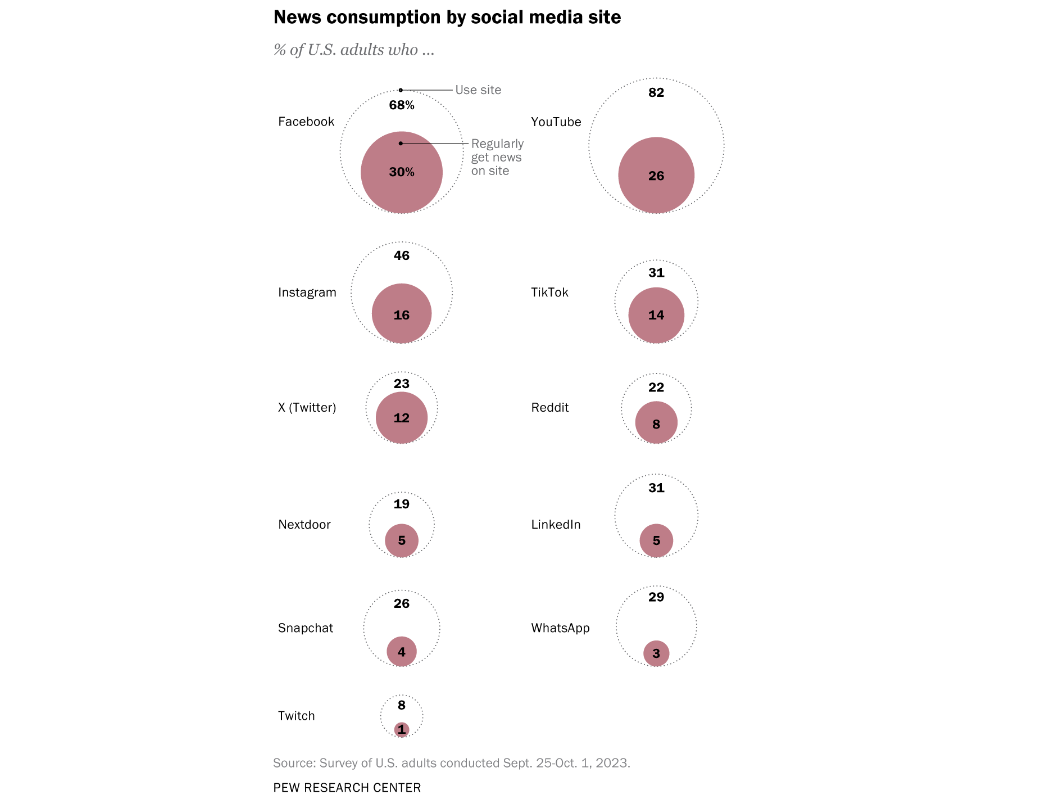
In 2023, 16% of US adults regularly got news38 on Instagram, outpacing TikTok, X, and Reddit
This is up from just 8% in 2018. Additionally, more than 50% of that group were women.
Between July and September 2023, global users spent 15 hours and 50 minutes39 per month on Instagram, up from 12 hours40 in 2022.
This put Instagram in 5th position behind:
- TikTok - 34 hours per month
- YouTube - 28 hours and 5 minutes per month
- Facebook - 19 hours and 47 minutes per month
- Whatsapp - 17 hours and 6 minutes per month
The average active user opened the Instagram app 348 times each month.
Meanwhile, the average time spent per session was 2 minutes and 44 seconds. This was behind:
- YouTube - 7 minutes and 25 seconds
- TikTok - 5 minutes and 56 seconds
- Facebook - 3 minutes and 42 seconds
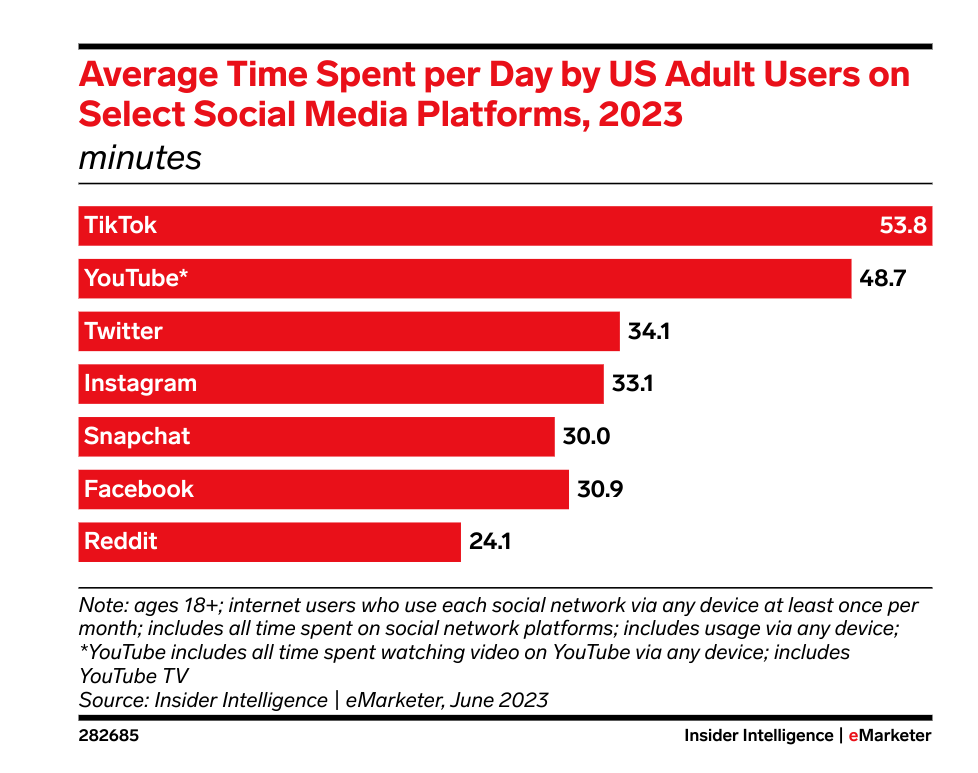
US users, in particular, spent 33 minutes a day on Instagram41 in 2023.
This was just behind:
- TikTok - 54 minutes
- YouTube - 49 minutes
- Twitter - 34 minutes
Globally, engagement on Instagram42 was just behind TikTok’s 95 minutes at 62 minutes.
Driven by the popularity of its reels, Instagram has outperformed TikTok in adoption in recent years.
Instagram App Statistics
As of March 2024, Instagram overtook TikTok as the most downloaded app.
Instagram’s total number of app downloads increased by 20% in 2023 to 768 million, ahead of TikTok whose downloads increased by 4% to 733 million over the same period.
In February 2024, Instagram was downloaded 21 million times43.
During this time, the app has generated over $11 million.
Between September and November 2023, Instagram had the following mobile app rankings
- #2 in terms of downloads.
- #5 in terms of total time spent in-app.
- #8 in terms of monthly active users.
Instagram Web Statistics
Instagram had 7 billion total visits44 to Instagram.com in March 2024, up 7% from the previous month.
Traffic to the site placed Instagram in second place globally and fifth in the US, just behind Facebook. On average, users visited 12 pages and spent 8 minutes and 20 seconds on the site. Additionally:
- The US sent the most traffic to Instagram.com (19.4%)
- This was followed by Brazil 8.7%
- In third place is India at 4.4%
The age distribution of visitors accessing Instagram via desktop was:
- 18 to 24 year olds - 20%
- 25 to 34 year olds - 31%
- 35 to 44 year olds - 20%
- 45 to 54 year olds - 14%
Instagram Influencer Statistics
In 2024, marketers will spend $2.2 billion on influencer campaigns on Instagram.
This is more than double what they will spend on Facebook.
The Instagram influencers with the highest number of followers45 as of March 2024 were:
- Cristiano Ronaldo - 624 million
- Lionel Messi - 501 million
- Selena Gomez - 430 million
- Kylie Jenner - 400 million
- Dwayne Johnson - 398 million
The highest-paid Instagram influencer as of January 2024 was also Cristiano Ronaldo46. The footballer pulled in an estimated $3.2 million per post.
This was followed by:
- Leo Messi - $2.6 million
- Selena Gomez - $2.6 million
- Kylie Jenner - $2.4 million
- Dwayne Johnson - $2.3 million
Brands collaborated with influencers on around 5 sponsored posts per week in 2023.
This contributed to the global Instagram influencer market hitting $17 billion47.
According to studies, 98% of influencers shared sponsored content most often on feed posts in 2023.
This was followed by stories and reels.
In 2023, the average fraud influencer rate48 (buying followers, likes and comments, stories views, and comment pods) was 49%.
Although influencer fraud rates dropped significantly, going from 63% in 2019 to 45% in 2022, rates saw a slight increase year-over-year.
According to Statista, Instagram influencers with 1000 to 10000 followers49 made up over 65% of influencer accounts globally in 2022.
- In second place were micro-influencers with 10,000 to 50,000 subscribers, accounting for 28% of all influencers.
- Mid-tier influencers (50,000 to 500,000 followers) accounted for over 6% of the total.
- Mega-influencers and celebrities with more than one million subscribers accounted for 0.2%.
As of April 2023, Instagram engagement rates for posts published by business accounts were as follows:
- All post types had an engagement rate of 0.71%
- Photo posts had an engagement rate of 0.59%
- Video posts had an engagement rate of 0.58%
- Carousel posts had an engagement rate of 1.26%
The same research found that engagement rates were highest (0.98%) amongst business accounts with fewer than 10000 followers.
Meanwhile, business accounts with 10000 - 100000 followers had a slightly lower engagement rate of 0.68%. The lowest engagement rate (0.57%) was for businesses with more than 100,000 followers.
Instagram Ecommerce Statistics
As of 2024, 130 million Instagram users50 clicked on shopping posts.
Additionally:
- Instagram users were 70% more likely to purchase online.
- 70% of consumers looked for products on the platform.
- 90% of Instagram users followed at least one business profile.
- 60% of Instagram users learned about new brands on the platform.
- 50% of Instagrammers made a purchase straight from the app.
45% of Gen Z consumers named TikTok and Instagram as the top platforms51 influencing their purchase decisions in 2023.
This was followed by
- YouTube - 38%
- Facebook - 24%
- Snapchat - 17%
- Twitter - 14%
- Reddit - 7%
Research52 found that:
- The average order value for Instagram shopping was $65.
- Over 66% of Instagram users discovered new products through Instagram shopping.
- Instagram shopping drove social media sales up by 24%.
- Between 2017 and 2021, there was a 1,416% increase in Instagram shoppable posts.
- Over 90 million accounts used the tap-to-reveal shopping tag in October 2020.
- Instagram Shopping had over 25 million business profiles worldwide, with about 87% of businesses using the ‘Shop Now’ button.
2019 research found that Instagram had a Halo effect on brands. By simply being on Instagram, brands made a positive impression on potential shoppers.
Shoppers perceived brands on Instagram as:
- Popular - 78%
- Creative - 77%
- Entertaining - 76%
- Relevant - 74%
The same research also found that Instagram helped consumers with the following:
- Discovering new products or services - 83%
- Researching products or services - 81%
- Deciding whether to buy a product or service - 80%
Instagram Security Statistics
Between October and December 2023, Instagram took action53 on the following types of content:
- Graphic and violent - 17.5 million
- Adult content - 10.9 million
- Violence and Incitement - 9.6 million
- Bullying and Harassment - 8.8 million
- Hate speech - 7.4 million
- Suicide and self-injury - 4.9 million
- Restricted goods and services - 2.5 million
In 2023, Instagram experienced a steep increase in security incidents. The hacking of Instagram accounts54 reached a staggering 85%, affecting over 36,000 accounts monthly.
In addition:
- 70% of Instagram users were locked out of their accounts
- 71% of users had hackers impersonate them and contact their loved ones.
In 2021, 84% of social media account takeover victims55 reported that their Instagram accounts were hijacked by scammers.
- A whopping 68% of these victims didn’t regain access to their accounts.
- 49% clicked on a link in a direct message from a friend before losing access to their account.
- 20% of victims lost their accounts to cybercriminals by responding to crypto and other investment scams.
- 13% of victims mistakenly provided personal information, including 2FA codes, PINs, and one-time passwords, leading them to lose access to their social media accounts.
That same year, reports found that Instagram shared 79% of its users' data56, including browsing history and personal information with others online.
Instagram was dubbed the most invasive app, sharing the title with its parent company Facebook (Meta).
- Up to 86% of user data was used to sell more products and serve relevant ads on behalf of clients.
- 62% of user data on Instagram was shared with third parties and used to target users for marketing purposes.
Monetize Your Instagram Account with Whop
From these statistics it's clear to see that Instagram is a colossal social media platform with a vast audience - so if you have an account, why not use this to your advantage and monetize your Instagram?
With Whop, you can sell digital products (like courses and ebooks) and create subscriber-only communities and events. So, you create and grow your audience on Instagram and funnel them to your Whop, where they can pay for access to premium perks and content. Click through to learn more about making money with Instagram, or simply sign up as a seller on Whop today to begin making money from your followers!
Instagram FAQs
Which generation uses Instagram the most?
As Instagram's largest user base, Millennials use the Instagram app the most.
Who is Instagram's target audience?
Instagram’s audience is anyone 13 and older who wants a platform to upload and share photos or videos.
What age range uses Instagram the most?
Internet users aged 18 to 24 use Instagram the most.
Sources
Reference List
- Statista
- Power Digital Marketing
- Wired
- ZDNet
- NY Times
- Techcrunch
- Meta
- Techcrunch
- Later
- Business Today
- Techcrunch
- Hootsuite
- Economic Times
- Statista
- Pyments
- EMarketer
- The Guardian
- Business Insider
- Comparably
- Statista
- Techcrunch
- Techcrunch
- Techcrunch
- Business of Apps
- Data Reportal
- Data Reportal
- EMarketer
- WebFx
- Social Status
- Business of Apps
- EMarketer
- We as Social
- Pew Research
- Data Reportal
- Statista
- EMarketer
- Financial Times
- Sensor Tower
- Similarweb
- Visual Capitalist
- Influencer Marketing Hub
- Statista
- Statista
- Statista
- Wiser Notify
- Retail Dive
- Zipdo
- Meta
- Profile Tree
- Security World Market
- Cisomag


