As the most anticipated shopping event of the year, Black Friday has become synonymous with deep discounts and significant profits for businesses. In 2023 alone, Black Friday generated over $70 billion in online sales worldwide.
As the end of the year draws near, Black Friday is expected to break records and kick off yet another trillion-dollar holiday shopping season. At Whop, we've compiled over 100 Black Friday statistics to help guide your efforts in 2024. Read on as we explore shopping trends, forecasts, marketing strategies, and more.
Black Friday 2024 trends
- As shoppers opt for convenience, mobile shopping is expected to dominate online Black Friday traffic and sales.
- Budget-conscious shoppers will seek out early bird deals and competitive discounts to get the most out of Black Friday this year.
- Buy Now, Pay Later (BNPL) and other flexible payment methods are expected to encourage cash-strapped and inflation-wary shoppers to spend more.
- While channels like Social Media and Gen AI continue to gain momentum, particularly among younger consumers, Paid search is still superior and will drive the most sales this year.
Black Friday growth statistics
Black Friday’s origins can be traced back to the 1950s when massive crowds gathered in Philadelphia the Friday after Thanksgiving to watch the annual Army-Navy football game1.
For law enforcement, the large crowds were a nightmare, leading to the day being nicknamed Black Friday’. However, for retailers, the influx of shoppers was a welcome sight.
Throughout the 1970s and 1980s, retailers noticed how sales consistently surged during this period. They cashed in, seeing profits that put their businesses ‘in the black’—an accounting term that refers to profitability.
In the 1990s, Black Friday took off mainly due to large retailers like Walmart, Macy’s, and Target adopting the practice of slashing their prices on the day.
By 1993, Black Friday was the busiest shopping day of the year in the US. Over the next couple of years, the shopping event evolved into a crucial part of the holiday retail calendar for businesses and consumers alike.
As ecommerce gained momentum in the 2000s, retailers noticed a 77% spike in online sales after Black Friday. They dubbed this phenomenon Cyber Monday2.
With ecommerce accounting for a significant share of Black Friday and Cyber Monday sales,
the 2010s saw Black Friday gain traction internationally.
By 2019, 50-60% or 129 of the world’s countries participated in the shopping event.
Across the world, Black Friday has become the most eagerly awaited sale event of the year.
In 2024, the US ranked 8th for Black Friday shopping intent across 17 key markets. This was behind:
- The UAE - 54%
- Italy - 49%
- Australia - 44%
- Spain - 44%
- Canada - 43%
- Singapore - 41%
- France - 34%
With the shopping landscape evolving, Early Black Friday sales are growing in popularity4. In fact, 60% of consumers now start their holiday shopping in October or November.
This shift comes as shoppers become more budget-conscious and seek out extended discounts and sales.
Consequently, Amazon Prime Day (Early October) has taken hold, with close to 75% of shoppers regularly participating in the event.
As consumers become more intentional with their spending, 44% plan their Black Friday purchases more than a week in advance, up from 38% in 2023.
For over 60% of consumers, a key motivator for planning purchases in advance is buying gifts. Last-minute shopping has fallen out of favor, with only 4% of consumers starting their holiday shopping in December.
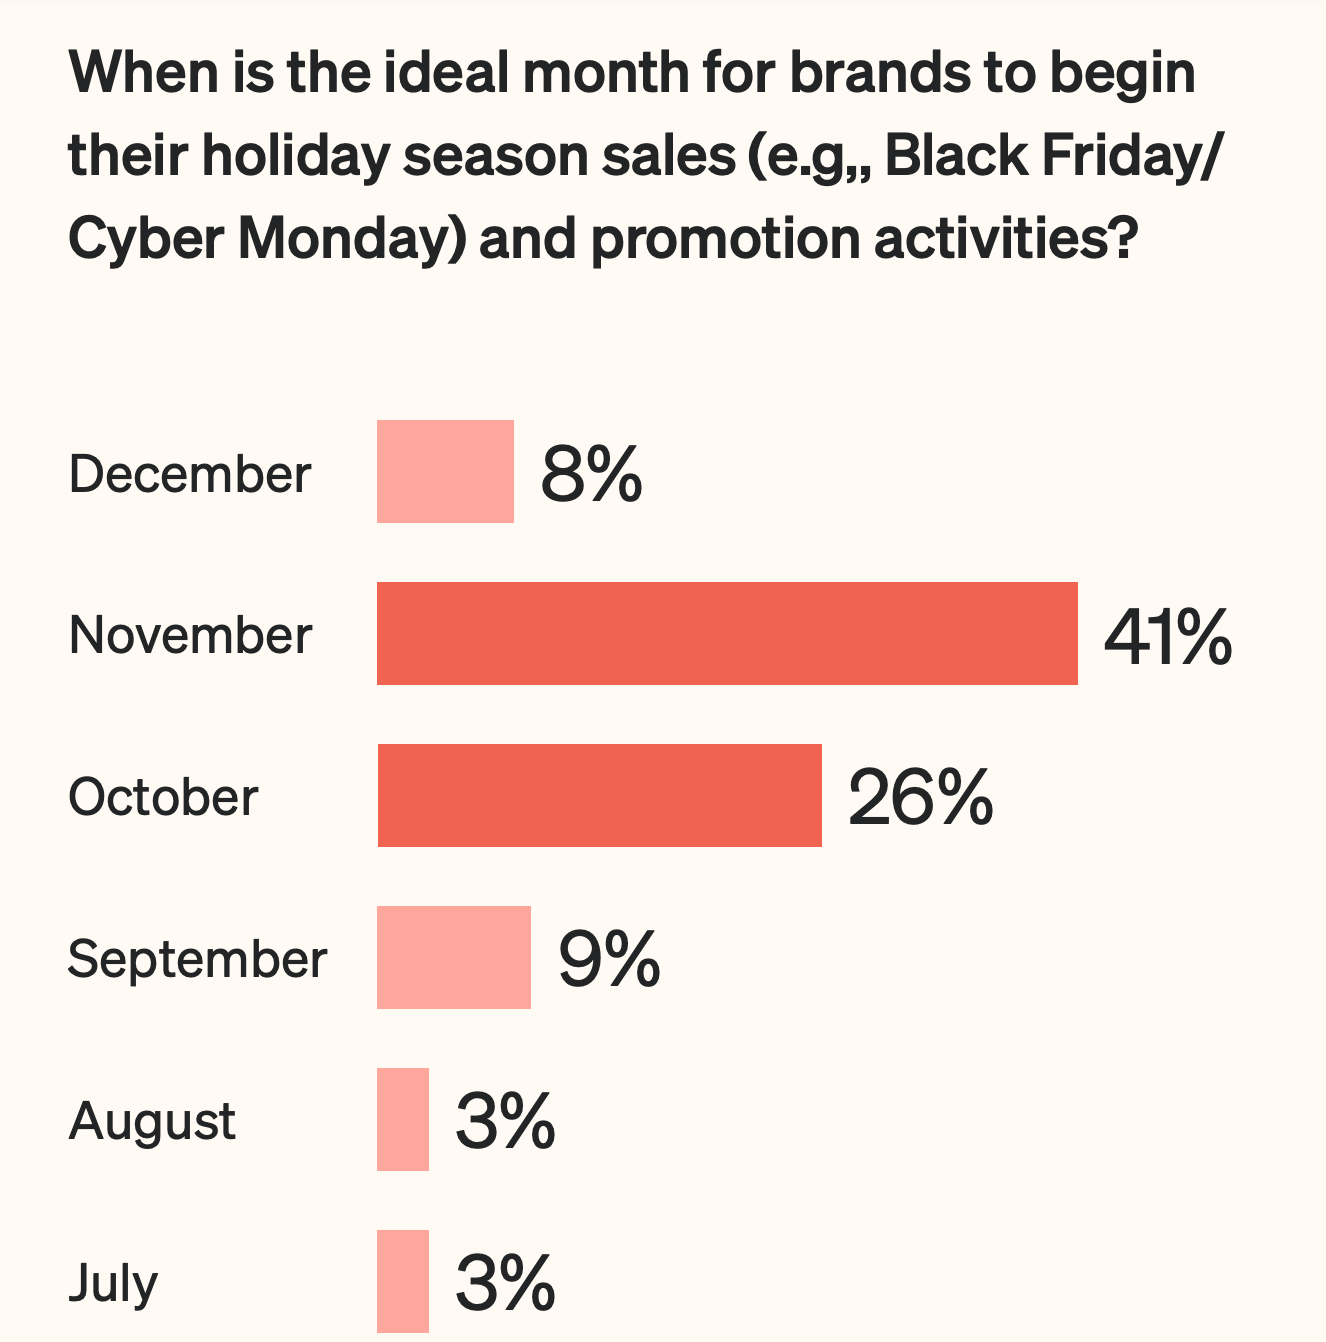
When asked about the ideal month for brands to begin holiday season sales and promotion activities, 41% of consumers selected November.
However, 26% also answered October, while 9% selected September. Only 8% selected December.
For brands wanting to stand out from the competition, the consensus is to launch deals earlier, particularly across the peak shopping season in October and November when 58% of consumers typically start their shopping.
Starting consumer education or generating awareness earlier is also recommended as 61% of consumers take longer than a week to make their first purchase after discovering a brand. Only 23% of consumers discover a brand and make a purchase on the same day, while 15% buy within the first week.
Black Friday sales statistics
Global holiday sales (November through December) will reach $1.19 trillion in 2024, up 2% from 20235. As one of the world’s leading ecommerce markets, the US is expected to contribute a whopping $277 billion to this figure.
The modest growth is primarily due to value-seeking consumers trading down, strategically waiting for discounts, and choosing low-cost Chinese shopping apps.
In 2024, Black Friday is expected to see the most sales growth with over $10.8 billion generated in revenue. Year-over-year, this is a notable 10% increase6.
Over the years, Black Friday online sales revenue in the US has trended upward, increasing from just $534 million in 2008 to $7.4 billion in 2019 and over $9 billion in 2022.
Overall, Black Friday and Cyber Week sales are expected to drive $40.6 billion in revenue.
That’s up 7% over 2023.
Global Black Friday sales crossed the $70 billion mark in 2023, reaching a record $9.8 billion in the US7.
While online sales increased by 8% from $65 billion, in-store sales lagged at 1.1% over the same period. This reflects a growing trend toward digital channels for holiday shopping.
Black Friday product statistics
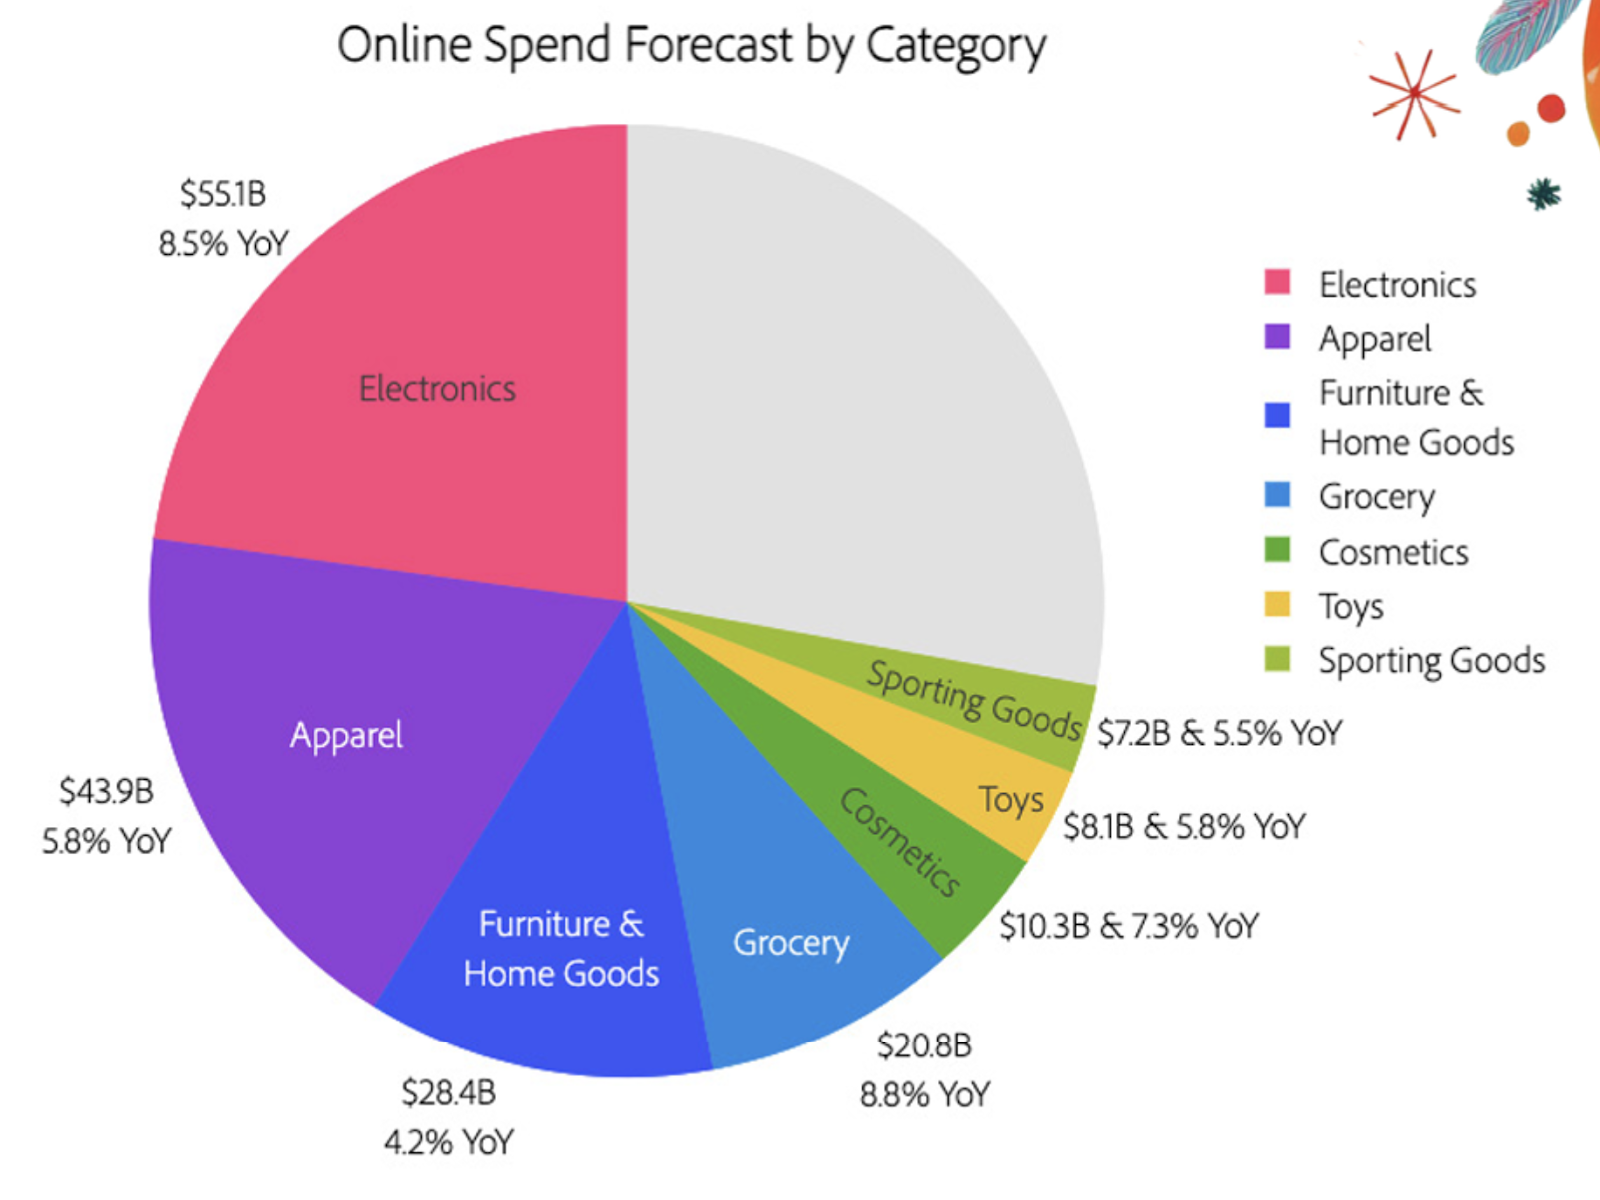
Electronics, Apparel, and Personal Care categories are expected to drive over 50% of online spend this Black Friday and holiday season.
- Sales in the electronics category will hit $55 billion, an increase of 8.5% from 2023.
- Sales in the apparel category will hit $44 billion, an increase of 5.8% from 2023.
- Sales in the furniture and bedding category will hit $28.4 billion, an increase of 4.2% from 2023.
Drivers of Sales this Black Friday
| Top Sales Drivers | Moderate Sales Drivers | Weak Sales Drivers |
|---|---|---|
| Toys Video Games Personal Care products Electronics | Apparel Sporting Goods Appliances Home and Garden | Grocery Pet Products Furniture and Bedding Tools and Home Improvement |
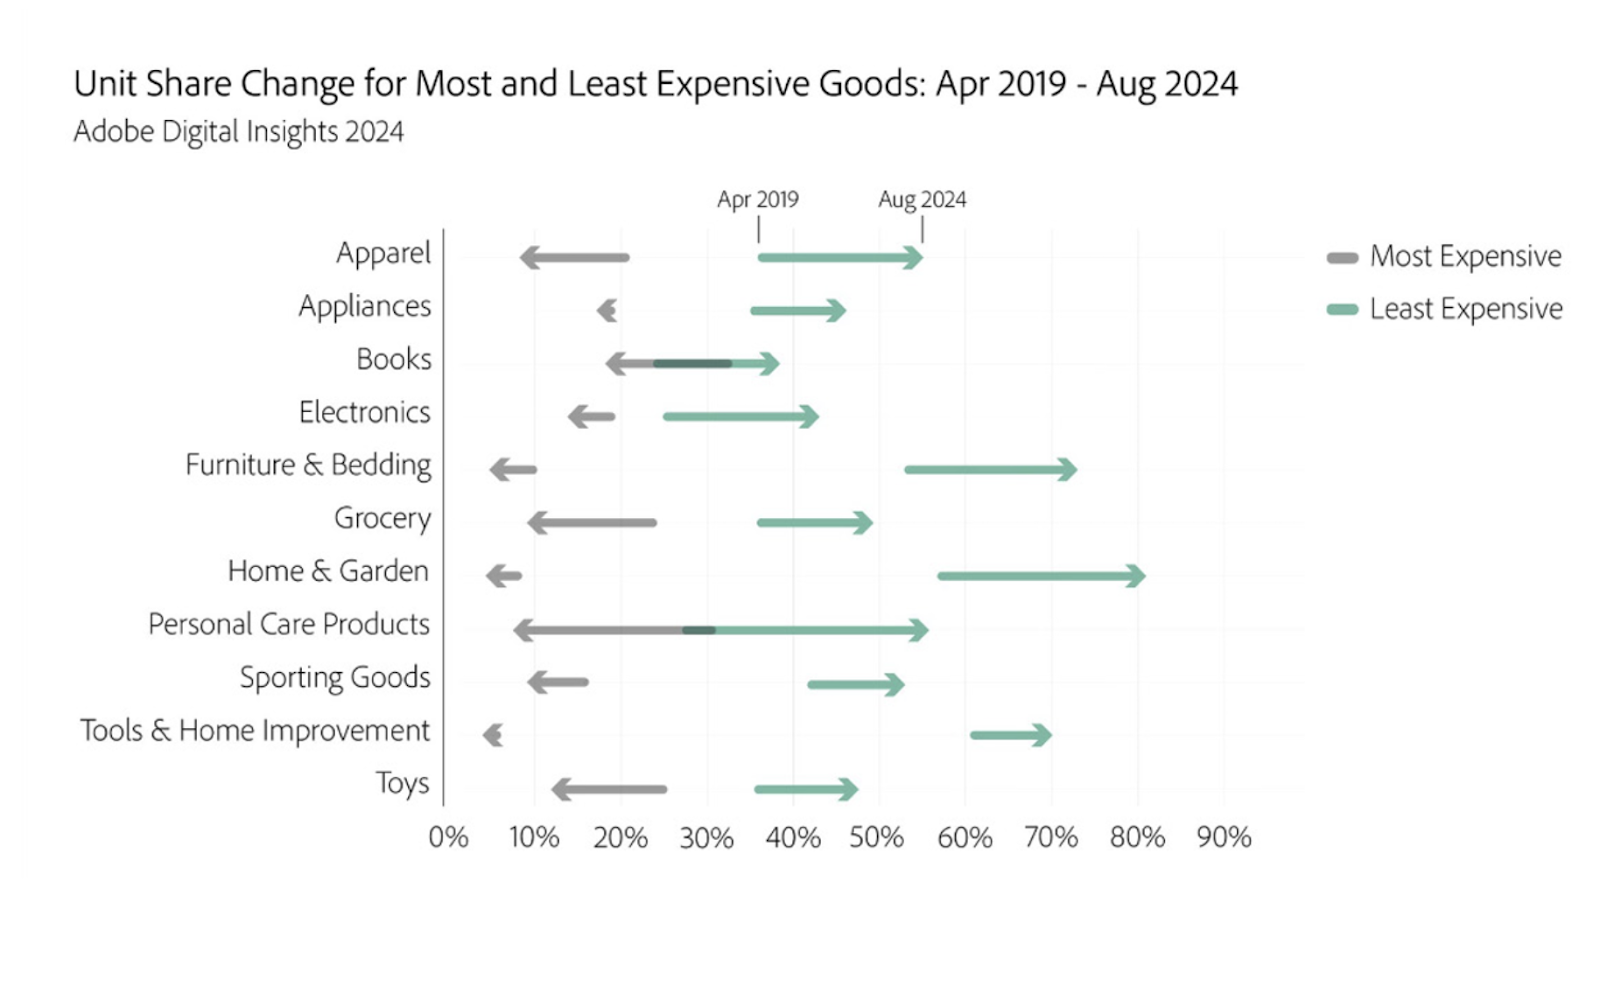
Driven by competitive discounts, the share of purchases of expensive goods across major ecommerce categories is set to increase by 19% this Black Friday and holiday shopping season.
Pre-holiday season, the effects of persistent inflation led consumers to purchase cheaper goods across major ecommerce categories. As a result, the share of the cheapest goods purchased by consumers increased significantly, by up to 46% across categories, while the share of the most expensive goods decreased by 47%.
Notably, in the sporting goods category, the share of the most expensive goods is expected to increase by up to 76%.
Other categories where consumers are likely to make expensive purchases include electronics and appliances where the share of the most expensive goods is expected to increase by 58% and 40%, respectively.
65% of male shoppers are more likely to shop for tech products on Black Friday, compared to 45% of female shoppers.
Female shoppers are more likely to shop for clothing (64%) and gifts (57%) instead.
71% of shoppers aged 18-34 and 54% of shoppers aged 35 and over are more likely to shop for clothing,
Shoppers aged 18-34 are least likely to buy cosmetics and beauty products while shoppers aged 35 and older are least likely to buy household products.
Black Friday discount statistics
Similar to 2023, major discounts of up to 30% of listed prices are expected this Black Friday and Holiday shopping season.
The consumer response to discounts is expected to contribute $2 billion to $3 billion in online spend.
Discounts as high as 30% off the listed price are expected to drive shoppers to “trade up” in key categories like electronics, appliances, and sporting goods.
In total, this will contribute over $2 billion in incremental spend.
Discounts for electronics are expected to peak at 30% off the listed price on Black Friday.
That’s slightly down from 31% in 2023.
Research suggests that the 20-29% discount range is the optimum bracket that converts best for verticals like sporting goods, jewelry, home and garden, and more.
Record discounts of up to 24% are anticipated for TVs, up from 23% in 2023.
Meanwhile, for sporting goods, discounts of up to 20% versus 18% in 2023 are expected.
Other key categories offering significant discounts will include:
- Apparel at 23%, slightly down from 24% in 2023.
- Computers at 23%, slightly down from 24% in 2023.
- Furniture at 19%, down from 21% in 2023.
Black Friday shopper statistics
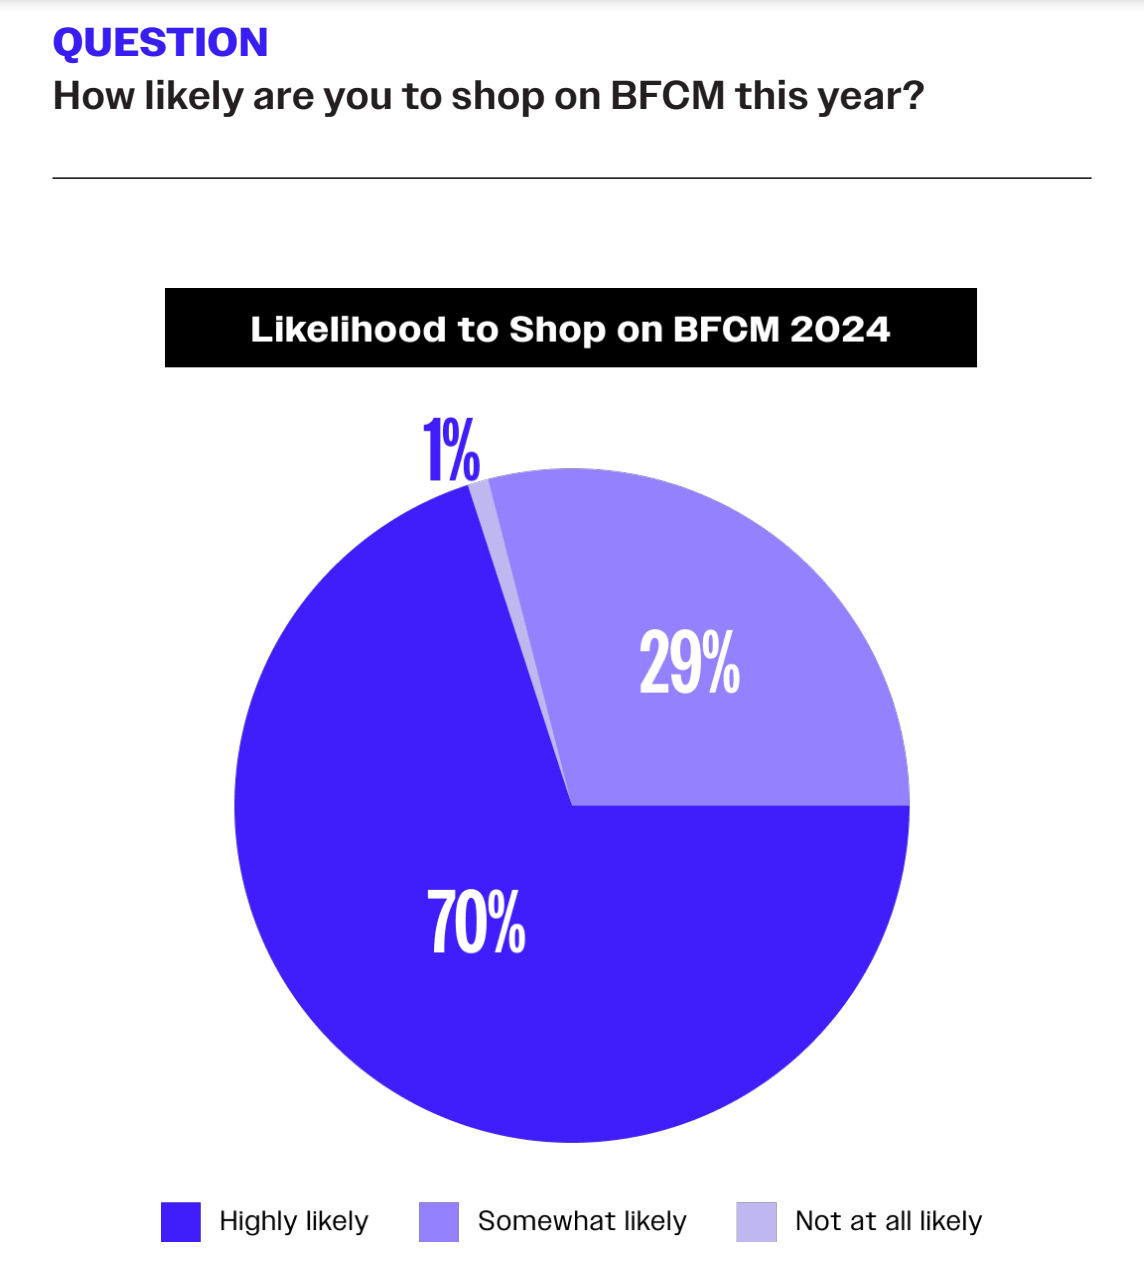
As the most anticipated event of the shopping calendar, over 70% of consumers are likely to participate in Black Friday.
This is consistent across all generations, highlighting the universal appeal of the major shopping event.
Generally, more than 30% of US shoppers take part in both Black Friday and Cyber Monday sales each year. However, this year, 16% of shoppers will opt out of Black Friday and Cyber Week, down 2% from 2023.
The most common reason for not shopping is a dislike of crowds at 54%, followed by no interest in the products being offered at 24% and not wanting to spend money at 18%.
Additionally, compared to other generations, Baby Boomers are most likely to opt out of shopping on Black Friday and Cyber Week.
Of those planning to shop on Black Friday and Cyber Week, 87% will do so to take advantage of discounts and deals.
69% of shoppers plan to buy items they’ve been wanting to see drop in price, while 57% plan to start or wrap up their holiday shopping.
At 81%, promotions are the leading factor shoppers choose to buy on Black Friday8.
Other reasons include:
- Free shipping at 77%
- Availability of products at 68%
- Return/exchange policies at 50%
- Fast shipping times at 49%
Shoppers most preferred Black Friday promotional offers include discounts (44%) and Buy one get one free (34%).
This is followed by a gift with purchase (9%) as well as buy more, save more (6%).
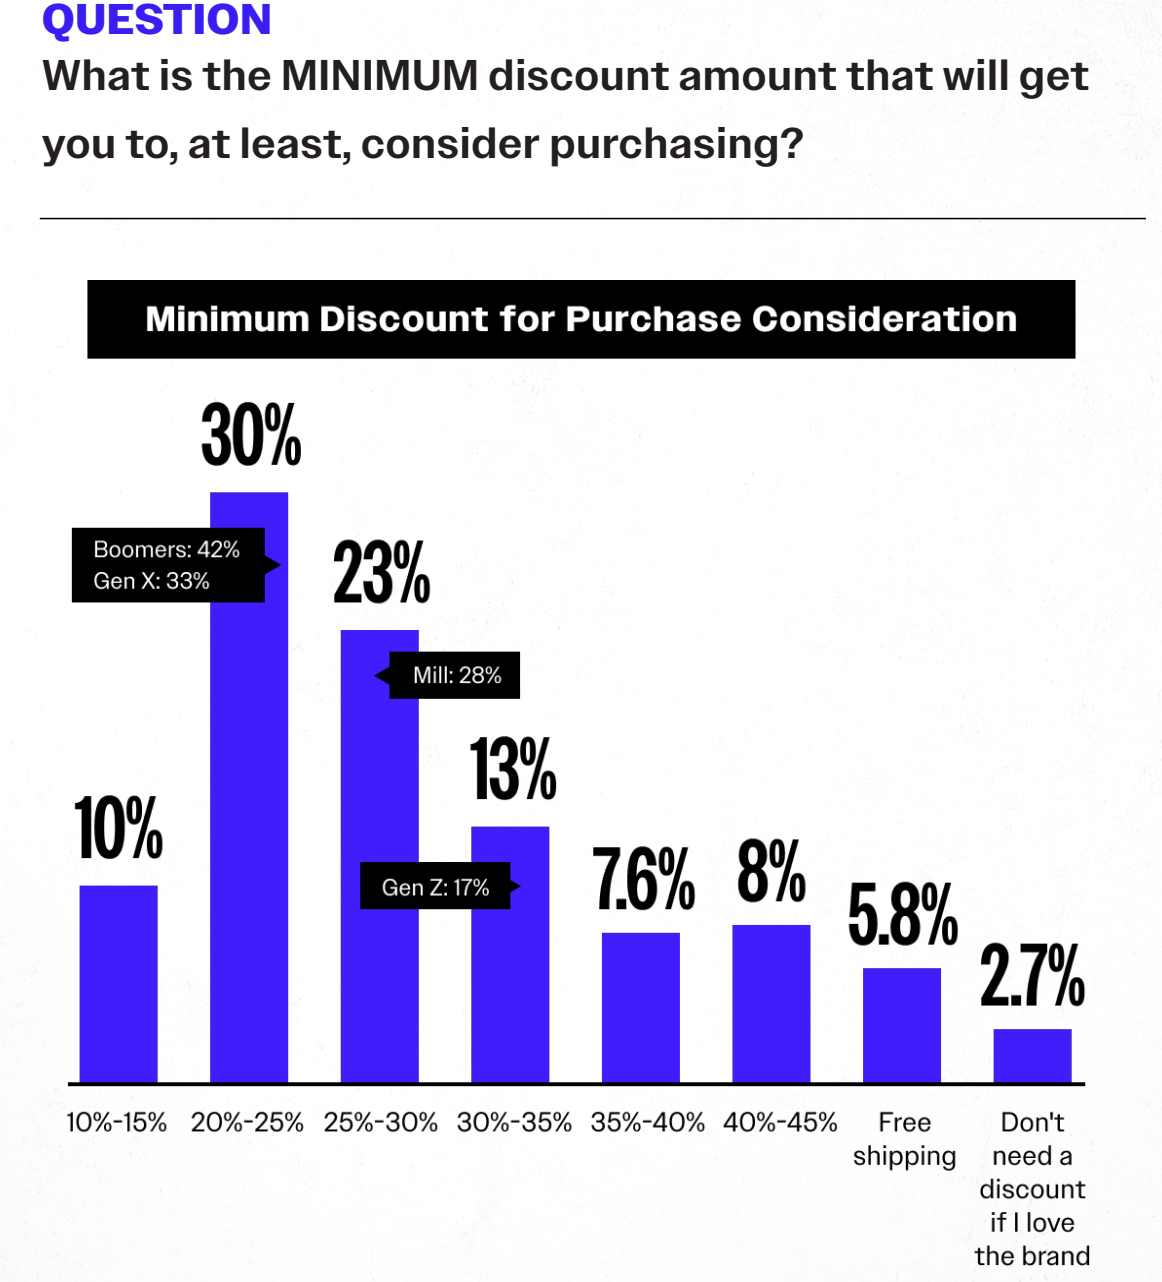
For shoppers to consider Black Friday ‘worth it’, the minimum discount a majority of shoppers (30%) expect is 20%-25%.
This is followed by 23% of shoppers who consider discounts of between 25%-30% as the minimum for them to consider purchasing.
At 65%, high shipping costs remain the top reason shoppers abandon their carts.
This is followed by:
- A cart total being too high at 38%
- Creating a wishlist/ wanting to come back later to place an order at 26%
- Slow checkout at 30%
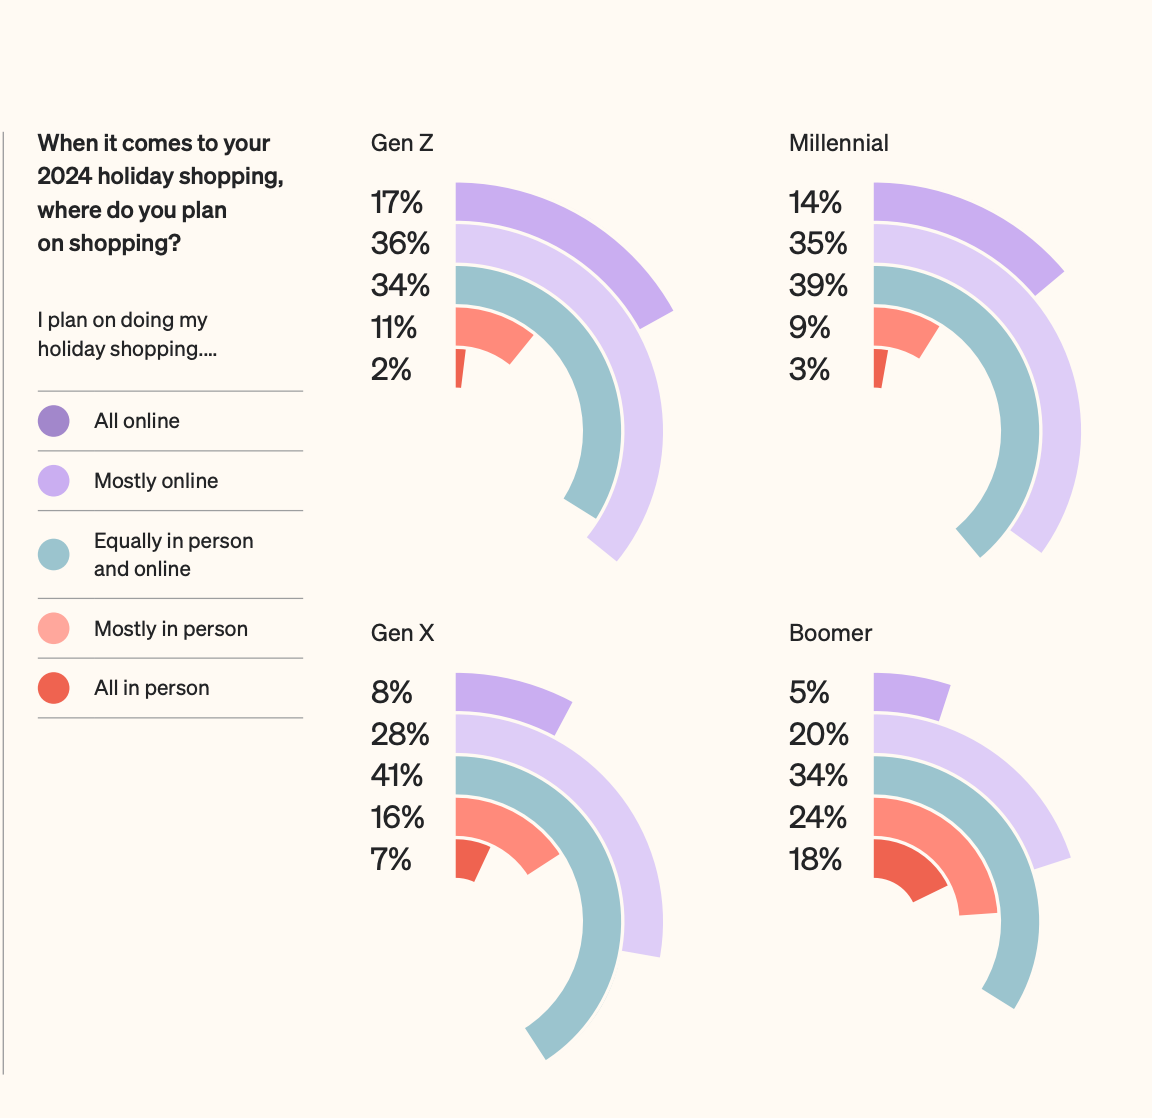
29% of shoppers plan to shop in person this Black Friday, up 2% from 2023.
In-person shopping will be significantly lower compared to 2022 where 43% of shoppers chose to shop in person.
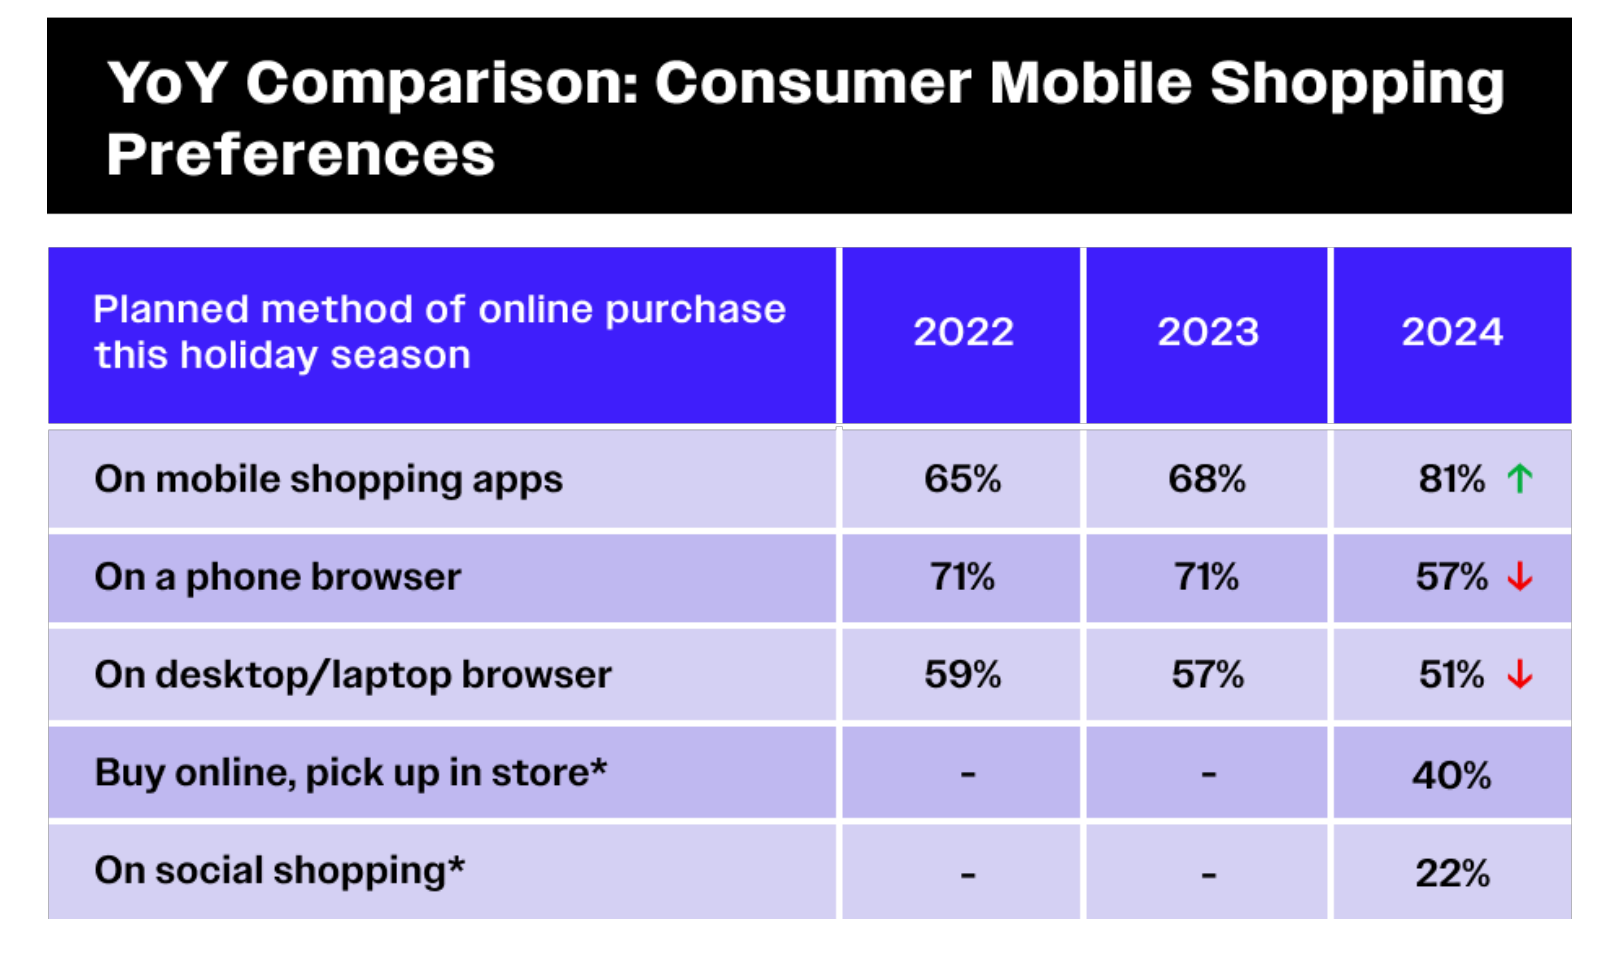
Meanwhile, 40% plan to buy online, and pick up in-store (BOPIS) as part of the trend towards greater convenience during this holiday shopping season.
Generally, the desire to shop in person increases with age. 18% of Boomers and 7% of Gen X shoppers plan to shop all in person.
This is compared to 3% of Millenials and 2% of Gen Z shoppers.
Of those shopping in-person, Walmart will be their first choice at 71%, while Target (67%) will be their second.
Other popular choices for in-person shopping include Kohl’s (39%), Macy’s (38%) and Best Buy (37%).
81% of in-person shoppers will purchase clothing and accessories on Black Friday and Cyber Monday.
In second place, 75% of shoppers will shop for electronics, followed by household appliances (43%) and Health & Beauty products.
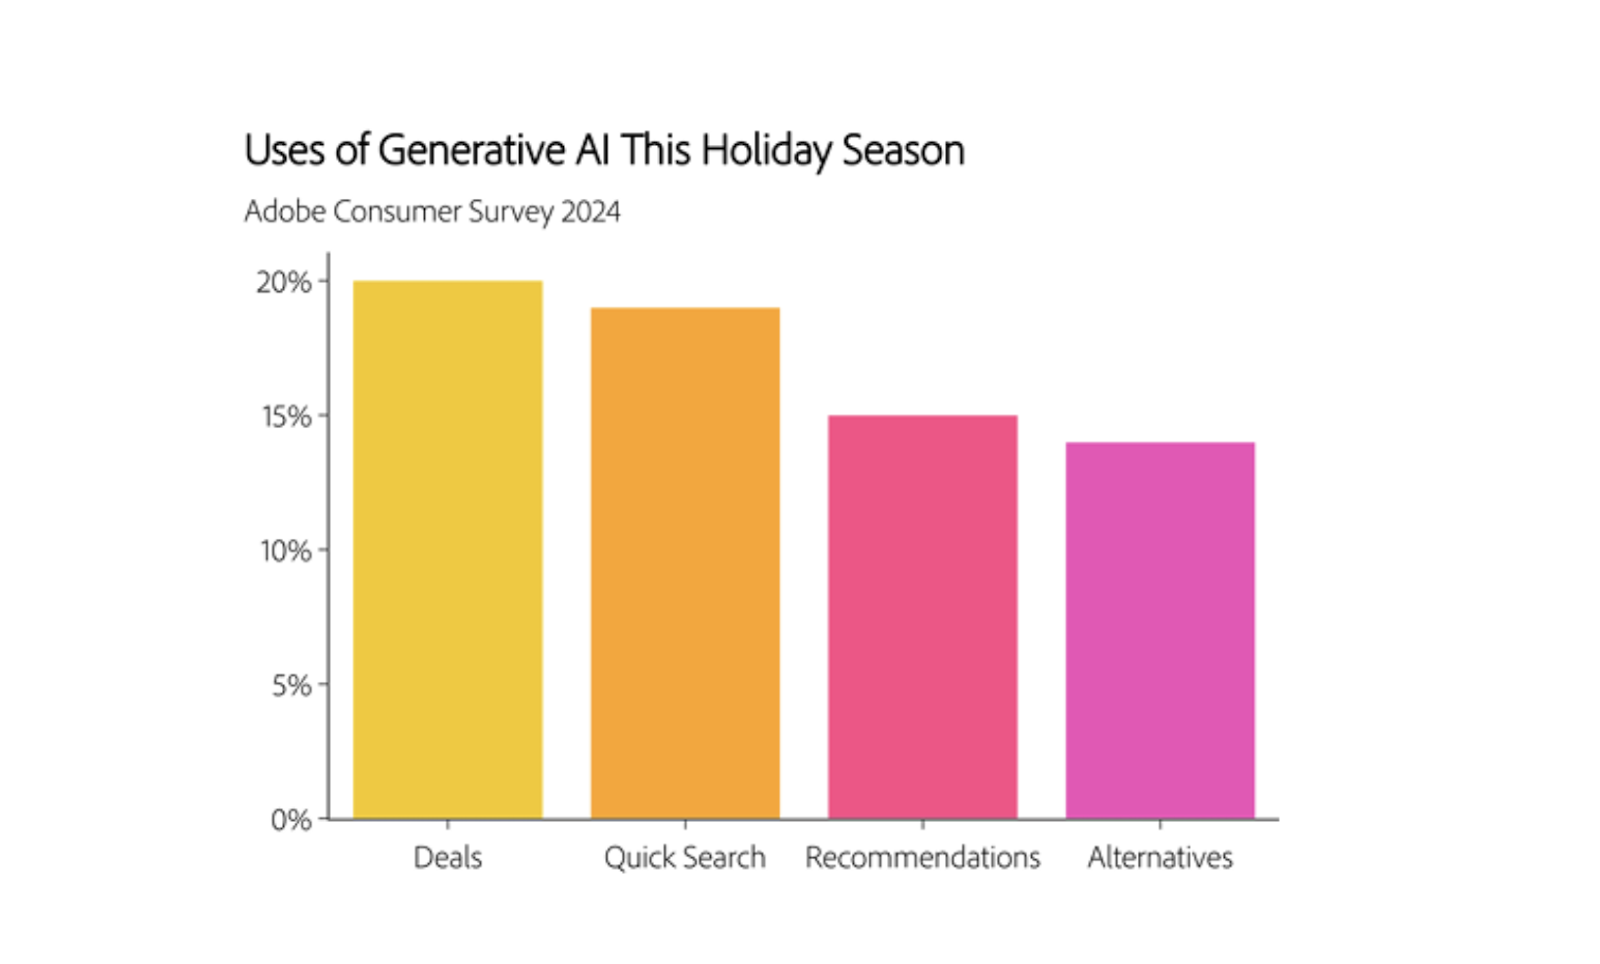
In an upward trend, 40% of shoppers will turn to generative AI tools this Black Friday and holiday shopping season.
70% of consumers report that generative AI tools enhance their shopping experience. Additionally, 20% use generative AI to find the best deals, find specific items online quickly (19%), and get brand recommendations (15%).
30% of shoppers will begin their shopping from 5 am to 10 am on Black Friday.
- 17% will shop between 10 am to 2 pm.
- 13% will shop between 12 am to 5 am.
- 6% will shop after 2 pm.
More than 50% of shoppers are planning to shop both new and known brands this Black Friday and Cyber Monday.
Additionally, 28% of shoppers plan to stick to the brands they know and love, while 17% plan to take advantage of Black Friday to try new products.
65% of Black Friday shoppers will discover Black Friday deals on retailers’ websites
61% of shoppers said promotional emails were the main way they discovered sales. This was followed by retailer promotional social media ads at 51%, and recommendations from family and friends.
When asked about how they feel about Black Friday and Cyber Monday (BCFM) shoppers say they mainly feel excitement or thrill (48%). This is higher at 56% for Gen Z shoppers.
Other emotions include:
- Satisfaction or accomplishment at 41% (This was higher for Gen Z at 44% and Boomers at 60%)
- Anticipation at 32%
- Motivation at 23%
Gen Z shoppers express the highest levels of negative emotions regarding Black Friday, with 28% stating that BCFM sales make them stressed/anxious.
A further 22% of Gen Z shoppers state feeling overwhelmed.
Black Friday spending statistics
In 2023 alone, shoppers around the world spent $1.17 trillion over the holiday season9.
Cyber Week, which includes Black Friday, accounted for over 25% or $298 billion of this spending.
Globally, $240 billion will be spent online during the 2024 holiday season.
This is up 8.4% from 2023 when shoppers spent $222 billion online. Overall,
online spending continues to trend upward from:
- $143 billion in 2019
- $189 billion in 2020
- $205 billion in 2021
- $212 billion in 2022
97% of consumers are aware that inflation is affecting the cost of goods and services10.
A further 88% say inflation is currently affecting their spending decisions.
80% of consumers are concerned about the impact of inflation this Black Friday and holiday shopping season. As a result:
- 48% say they’re comparing prices across retailers more than they did in 2023.
- 48% of consumers say they’ll buy cheaper alternatives more than they did last year.
- 46% say that paying full price for an item on their holiday gift list would prevent them from buying.
42% of shoppers will spend the same amount on Black Friday as they did last year.
22% plan to spend slightly less, while 22% plan to spend slightly more.On the other hand, 10% plan to spend much less, and 6% plan to spend much more.
Due to economic headwinds, 27% of shoppers believe they will spend much less on Black Friday in 2024.
This is versus 9% who believe they will spend much more than last year.
20% of shoppers will spend $1000 or more on Black Friday, a 3% decrease from the 23% of shoppers who planned to spend $1000 or more last year.
- 22% of shoppers plan to spend $400-$599
- 19% plan to spend $200-$399
- 14% plan to spend $600-$799
- 13% plan to spend $200
For those spending less, the rising cost of living will be the top reason for 80% of shoppers.
66% will be spending less this year due to increasing grocery costs, while 59% will be spending less due to inflation.
2% of shoppers don’t plan to spend any money on Black Friday.
This figure is the same as in 2023.
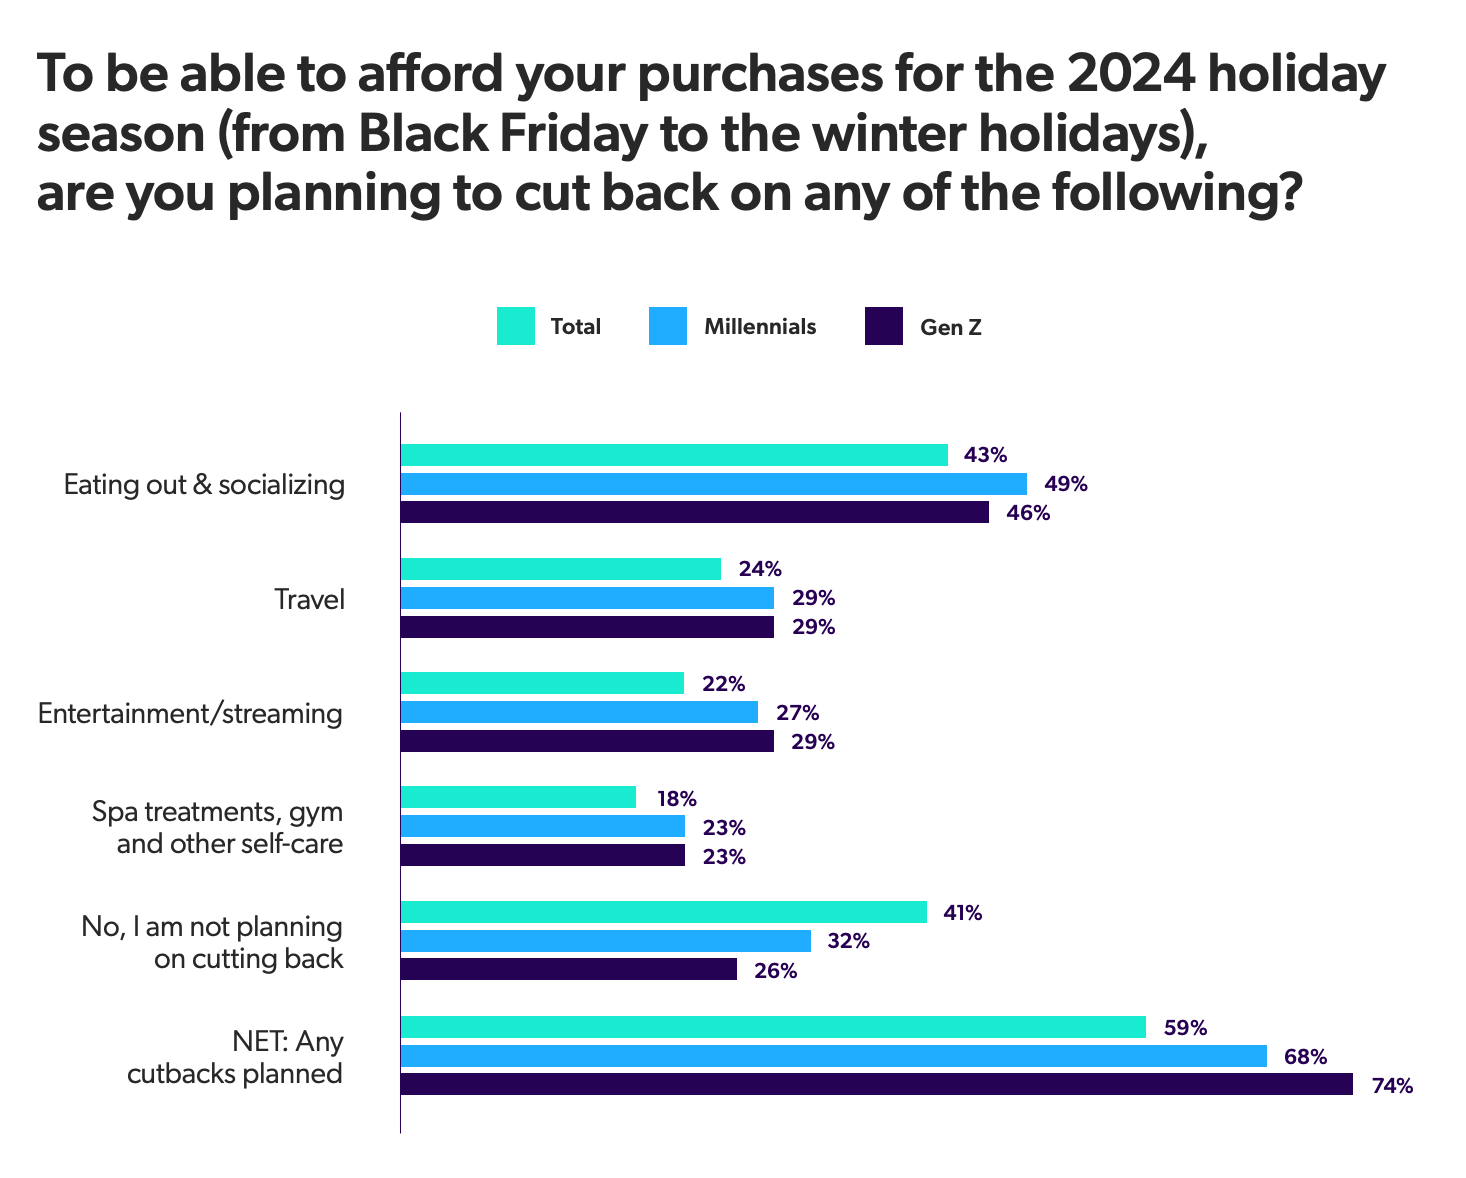
59% of shoppers intend to reduce their spending in other areas to afford their purchases for Black Friday and the rest of the holiday shopping season11.
Leading the charge are Gen Z and Millenials, with 74% and 68% respectively, planning to cut back on eating out, travel, and entertainment.
Compared to other generations, 13% of Gen Z shoppers are more likely to spend more on Black Friday this year.
Meanwhile, Millennials (24%) and Gen X (22%) plan to spend $1000 or more.
25% of female shoppers are more likely to spend less this Black Friday.
This is compared to 20% of male shoppers.
39% of consumers typically have a budget for Black Friday.
47% of consumers sometimes budget, while 14% don’t have a budget.
By generation, Baby Boomers are most likely to set a budget, and though their budgets are higher this year, Gen X and Millennial shopper budgets are higher. Only 30% of Gen Z shoppers plan to stick to a budget this year.
In 2023, most consumers spent between $200 and $300.
- 19% spent $100 to $200.
- 16% spent $300 to $400.
- 14% spent $400 to $500.
Based on income, 80% of all income groups besides $25k+ plant to spend the same or more on BFCM.
Specifically, 44% of those earning $75-99k plan to spend more than they did last year, while 69% of those earning more than $250k plan to spend the same or higher.
Looking at 2023 spending patterns:
- 36% of shoppers earning $150k+ spent $800 or more last Black Friday and Cyber Monday.
- 40% of shoppers earning $50k to $75k spent $300 to $500.
- 47% of shoppers earning $100k to $150k spent $300 to $600.
- 50% of people making less than $50k spent $100 to 300.
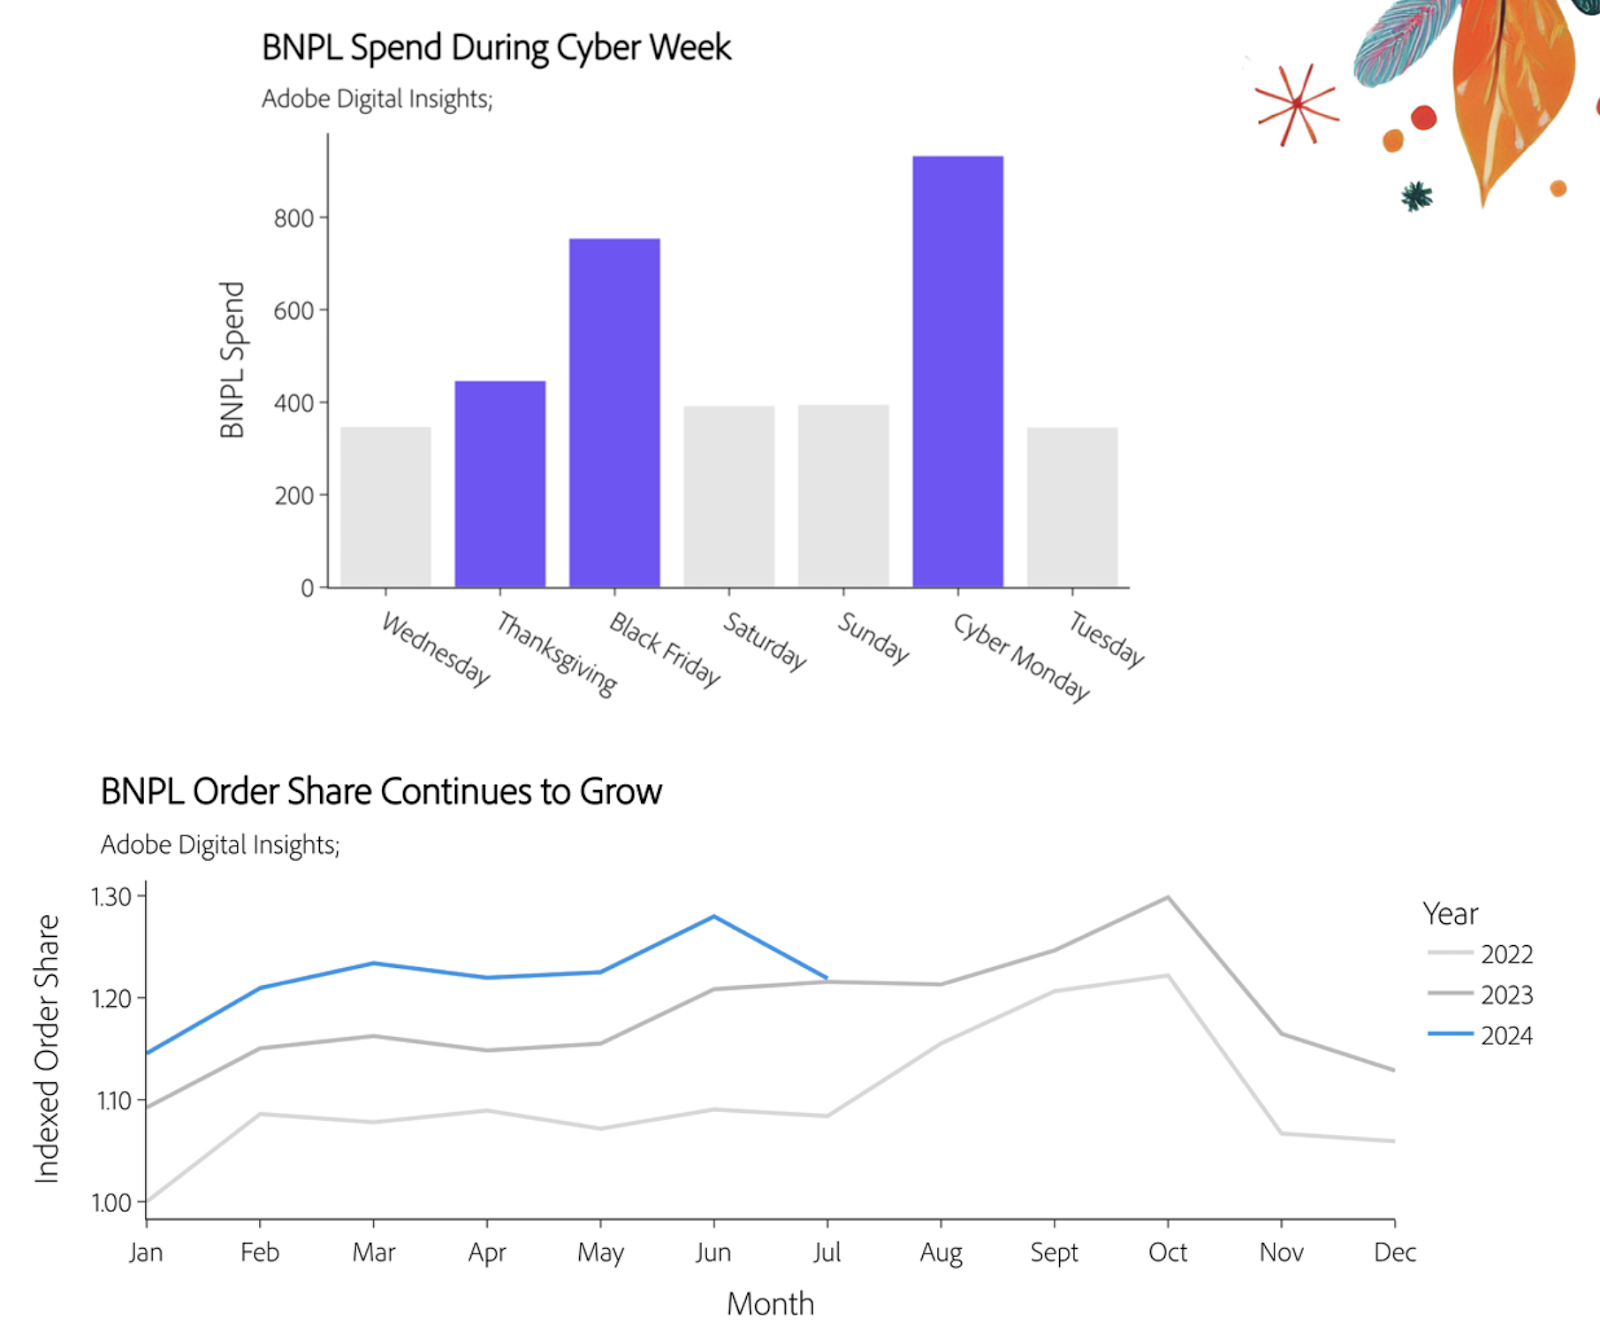
Buy Now, Pay Later (BNPL) is the payment method most expected to set new records this Black Friday and holiday shopping season, driving $18.5 billion in online spend.
This represents an 11% increase year-over-year.
BNPL will hit $9.5 billion during November 2024, making it the largest month on record.
While Black Friday BNPL spend is expected to hit close to $800 million, Cyber Monday will be BNPL’s largest day, with spending set to exceed $933 million.
BNPL will be driven by mobile shopping (74% to 79% share).
That’s compared to Desktop with a 74% share.
59% of consumers have either used or are interested in using BNPL options.
Of those who have used BNPL, over 30% say they would be more likely to spend more on discretionary purchases if a brand offered the payment option.
39% of millennials plan to use buy now pay later (BNPL) to fund their Black Friday purchases12.
This is followed by 38% of Gen Z. The most common reasons both age groups cited for using BNPL include freeing up cash (22%) and helping them buy something they couldn’t afford otherwise (19%).
Black Friday platform statistics
75% of shoppers plan to shop online on Black Friday.
This is up 7% from 2023. Additionally, Millennials are the most likely to shop online on Black Friday (84%).
At 85%, Amazon will be the top choice for online Black Friday and Cyber Monday shopping, down 3% from 2023.
In second place is Walmart (59%), up 8% from 2023. Other popular choices include:
- Target at 57%
- Best Buy at 29%
- Kohl’s at 28%
For those shopping online, 77% will purchase clothing and accessories, up 5% from 2023.
This is followed by Health & Beauty at 45% and Household Appliances (40%).
51% of consumers plan to do their Black Friday shopping via a laptop or desktop, down from 57% in 2023 and 59% in 2022.
Black Friday shopping via desktop browsers is on the decline and has fallen by a notable 8% since 2022.
Black Friday mobile commerce statistics
In 2024, 81% of shoppers plan to do their Black Friday and holiday shopping via mobile app, up from 68% in 2023 and 65% in 2022.
With a strong upward trend in Black Friday mobile app spending, a further 60% of consumers plan to shop via their mobile device browsers. 22% of consumers plan to use social media apps to shop, reflecting the growth of social commerce.
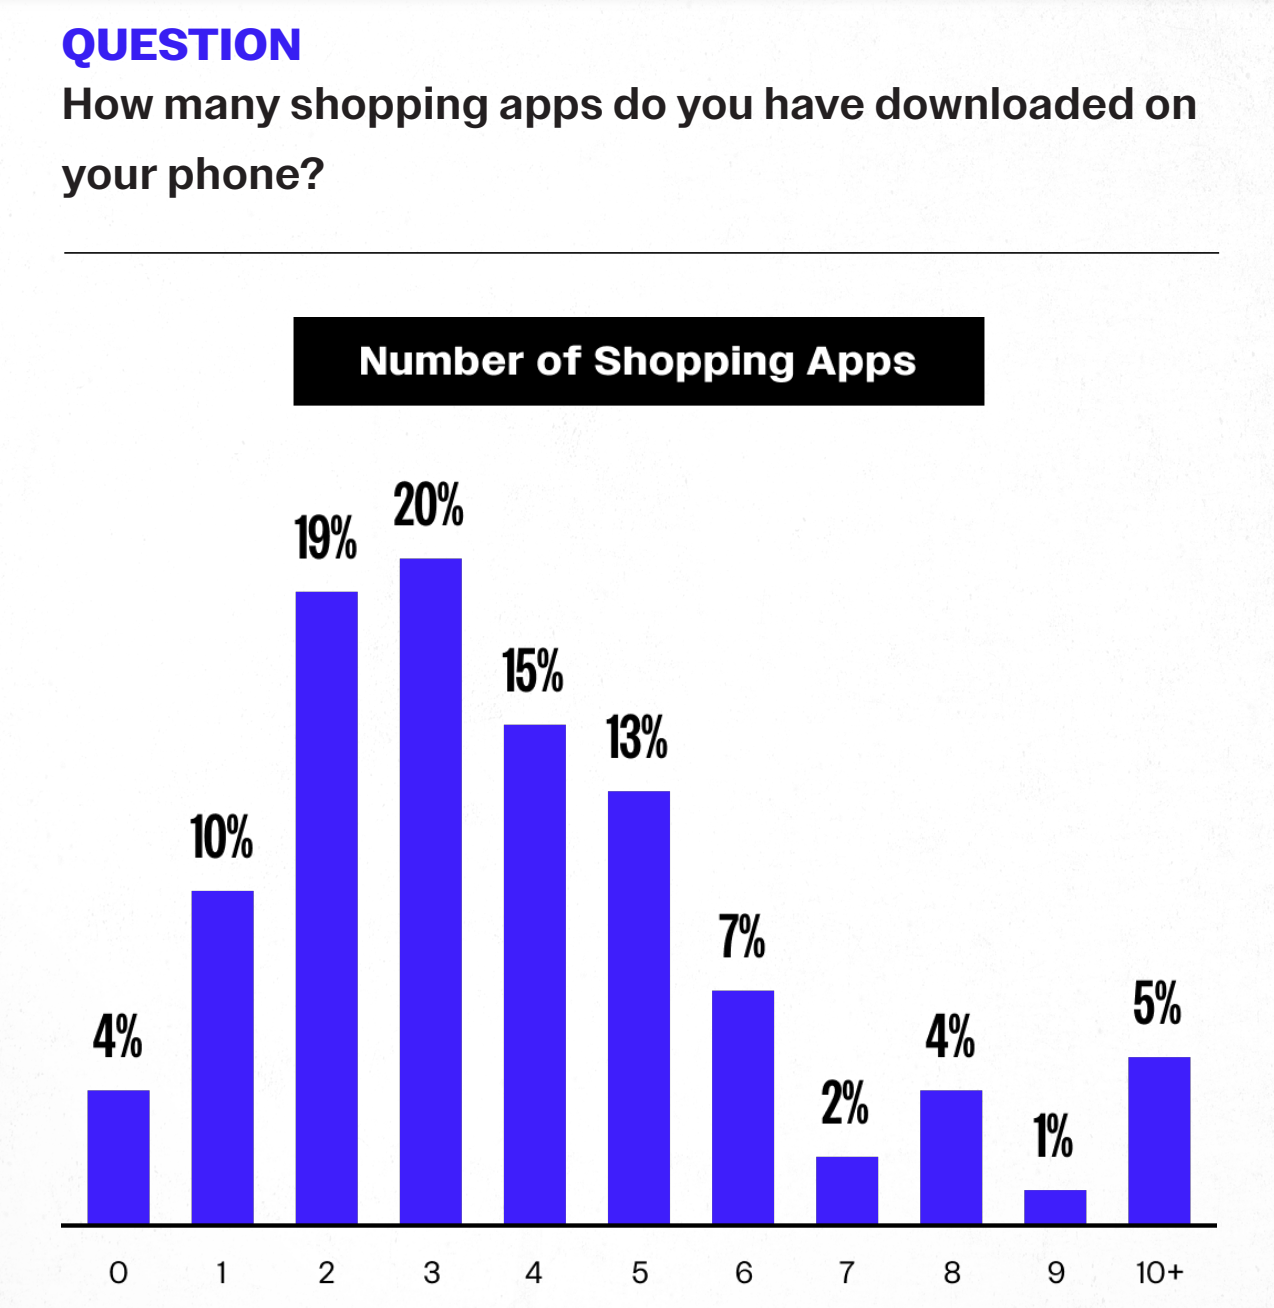
Over 75% of shoppers have between 1 and 5 shopping apps on their mobile phones.
In fact, 89% of Gen Z and 84% of Millennials view mobile apps as a must-have and 50% use shopping apps exclusively.
When shopping on their mobile phones, 30% of shoppers prefer to use a brand’s mobile app over their website (24%).
While 29% of shoppers have no preference, 16% would prefer to have both options available to them.
90% of shoppers have downloaded a brand’s mobile shopping app, with 50% of shoppers feeling this lends more trust and credibility to a brand.
Other reasons why consumers like mobile shopping apps, particularly for Black Friday include:
- Easier and more convenient shopping at 60%
- Better personalization at 44%
- Access to VIP customer perks at 34%
- Unique content at 27%
Over the 2024 holiday shopping season, 50% of shoppers plan to purchase from deep discount Chinese shopping apps like Temu, Shein, and TikTok.
Among Gen Z and Millennial shoppers, this figure is even higher, with 70% planning to use these apps for holiday purchases.
53% of Black Friday and holiday season shopping will take place through mobile devices, up 13% from 2023.
2024 Black Friday and holiday season shopping is expected to be the most mobile in recent years, hitting over $128 billion.
82% of consumers will use their mobile devices to compare prices in-store. Moreover, 51% of consumers now prefer mobile shopping even when a desktop is available.
Overall, Black Friday mobile commerce has taken hold, reflecting the vast improvements ecommerce brands have made to their storefronts and the mobile customer experience.
Black Friday marketing statistics
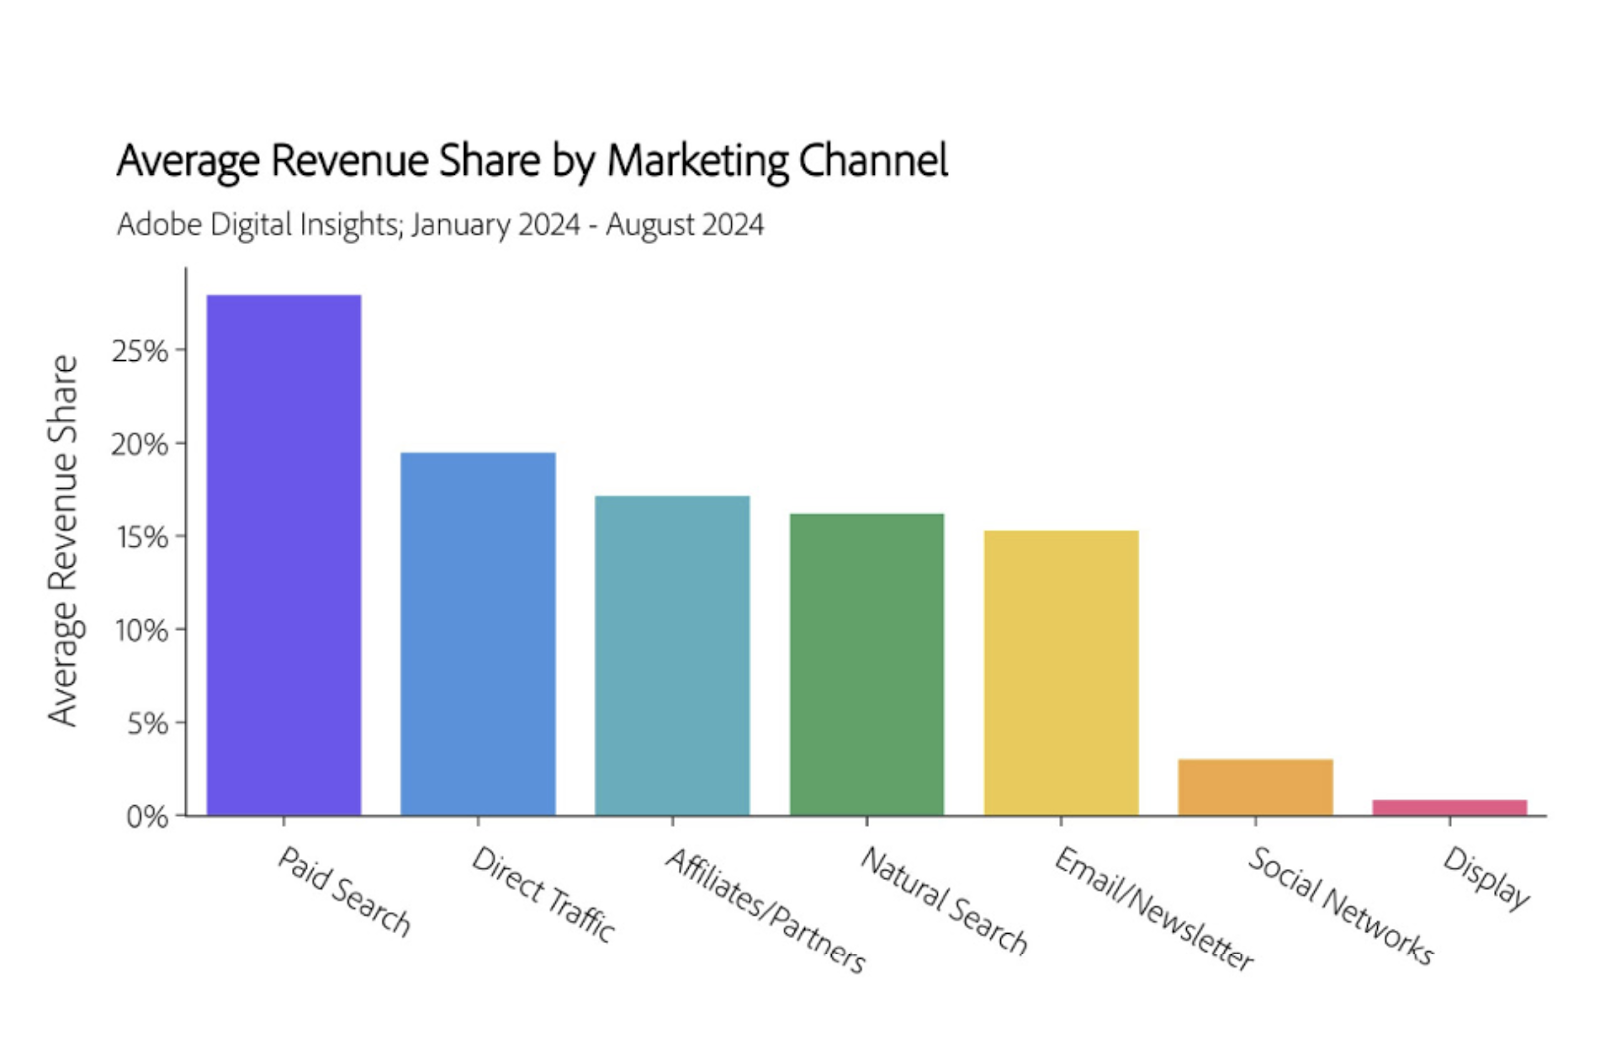
As a top driver of sales, paid search will account for up to 28% of online revenue over Black Friday and the holiday shopping season.
- In second place, direct traffic will account for 18% of online revenue.
- Affiliates and Partners will account for 17% of online revenue.
- Natural search will account for 16% of online revenue.
- Email and Newsletters will account for 15% of online revenue.
- Social Networks and Display will account for less than 5% of online revenue.
Paid search is expected to grow by 1% to 3% during this Black Friday and holiday shopping season.
- Natural search, however, is expected to drop further by 3 to 6% continuing its downward trend.
- The fastest growth (7% to 10%) is expected to come from Affiliates and Partners. This is followed by Social networks including social media influencers at 4% to 7%.
- Social and Display Channels, on the other hand, each generate less than 5% of revenue.
Social media channel traffic is expected to reach its annual peak on Black Friday, with an estimated 60-65% surge during the holiday season.
Particularly, compared to 2023, this Black Friday:
- TikTok’s share of traffic to retail sites is expected to increase by 70-75%
- Facebook’s share of traffic is expected to increase by 10-15%
- Instagram’s share of traffic is expected to decline by 1-5%
While GenAI as a channel is still in the early stages of adoption, traffic from sites like Chat GPT is expected to surge on Black Friday and throughout the holiday season.
Notably, traffic from Gen AI sources to retail sites has increased by 2x since January, while GenAI referrals are now 8x higher compared to 2023.
Black Friday promotion statistics
Online shopping websites are the most likely to drive awareness among Black Friday shoppers.
This is followed by online ads (44%) and social media (44%).
Social media was the most important Black Friday awareness driver (57%) for 18-34-year-old shoppers, while online shopping websites were the most important for shoppers over 35.
Shoppers typically hear about Black Friday sales via email (57%), followed by TV ads (51%).
This is closely followed by online ads at 50% and friends and family at 40%. The most popular social networks for discovering sales were Facebook (30%), Instagram (30%) and TikTok (17%).
Only 48% of consumers discover Black Friday offers via in-store or online store advertising or signage, the majority (80%) discover them via digital sources.
The key digital sources include email, social media, online search, and online marketplaces, highlighting the need for a consistent omnichannel experience.
60% of consumers are more likely to pay attention to marketing messages during Black Friday and Cyber Monday.
Only 12% of consumers are more likely to unsubscribe from marketing messages around this time.
The key reasons for unsubscribing include:
- Too many messages at 66% for Gen Z, 65% for Millenials, 62% for Boomers, and 56% for Gen X shoppers.
- Meanwhile, 58% of Boomers report a lack of interest in the brand and products as their key reason for unsubscribing.
Black Friday messaging is generally well-received with 75% of shoppers finding it somewhat appealing.
Around 25% find Black Friday messaging extremely appealing, with Gen Z and Millennials finding BFCM more appealing than other generations.
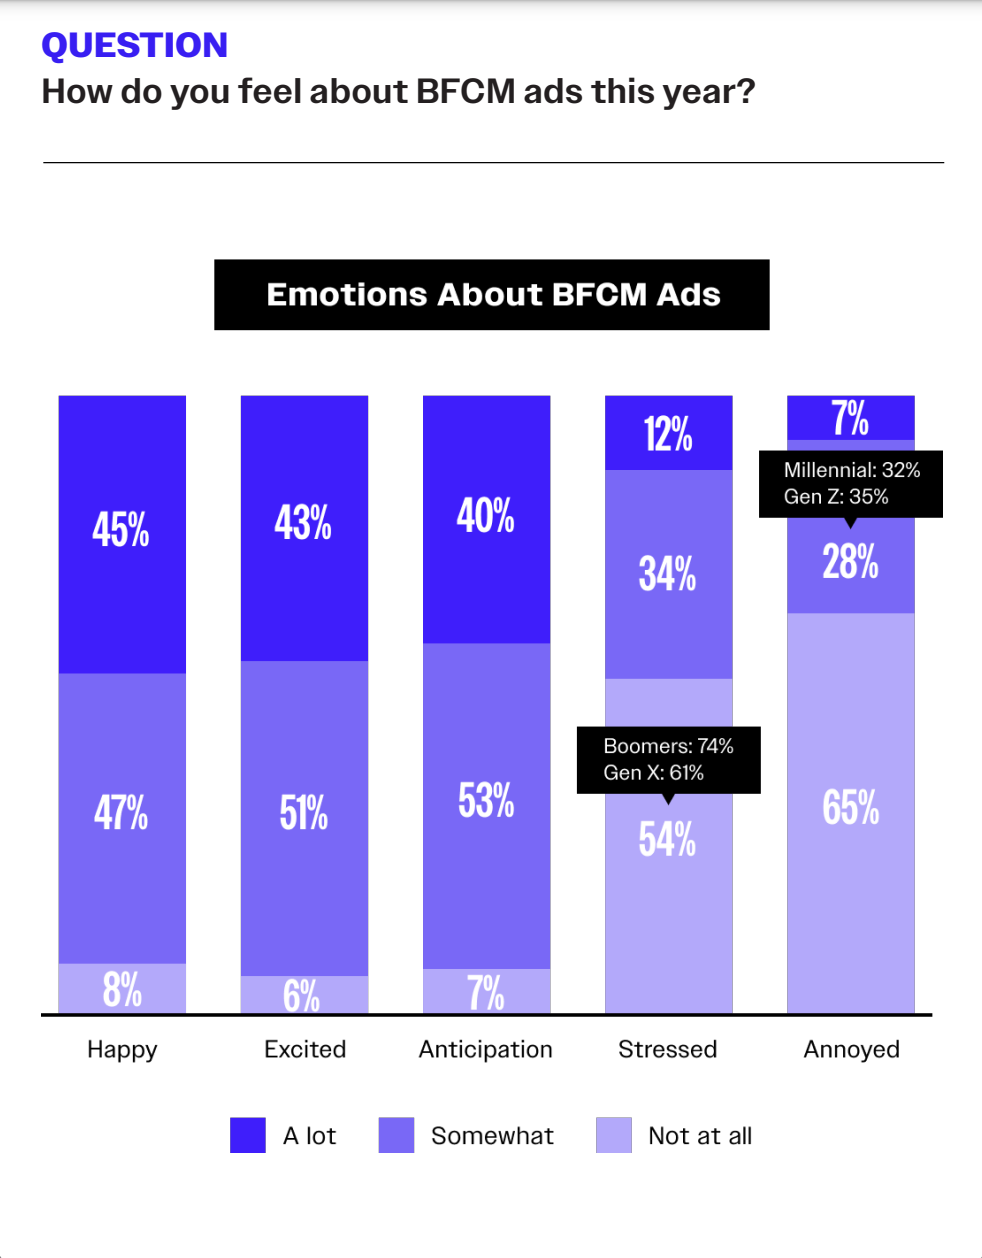
90% of shoppers report that Black Friday and Cyber Monday ads make them feel somewhat happy, excited, and anticipatory.
Additionally, 65% of shoppers are not annoyed by these ads, compared to 51% in 2023.
As of 2024, 64% of shoppers find Black Friday and Cyber Monday TV ads moderately to highly motivating.
Additionally:
- 59% of shoppers find Black Friday and Cyber Monday emails moderately to highly motivating.
- 54% of shoppers find Black Friday and Cyber Monday social ads moderately to highly motivating.
- 54% of shoppers find Black Friday and Cyber Monday print ads moderately to highly motivating.
- 45% of shoppers find Black Friday and Cyber Monday push notifications moderately to highly motivating.
- 40% of shoppers find Black Friday and Cyber Monday SMS messages moderately to highly motivating.
- 33% of shoppers find Black Friday and Cyber Monday influencer content moderately to highly motivating.
Each Generation is motivated by different types of Black Friday and Cyber Monday messages and ads.
- Baby Boomers are motivated most by TV ads (64%) and Print ads (60%).
- Gen X shoppers are motivated most by TV ads (73%) and Print ads (66%).
- Millennials are motivated most by TV ads (60%) and emails (58%).
- Gen Z shoppers are motivated most by Social media ads (71%) and Influencer content (50%).
Across the board (54% of Baby Boomers, 48% of Gen X, 47% of Millenials, and 38% of Gen Z) email marketing is the most effective type of promotional channel for Black Friday and Cyber Monday.
In second place are social media ads (22% of Baby Boomers, 37% of Gen X, 44% of Millennials and 47% of Gen Z).
This is followed by SMS messages (25% of Baby Boomers, 27% of Gen X, 27% of Millenials and 30% of Gen Z). Push notifications on mobile apps and influencer content come in third and fourth place, respectively.
In terms of favorite Black Friday promotional messages:
- Email marketing is the favorite for Baby Boomers (60%) and the least favorite for Gen Z shoppers (28%).
- Social media ads are the favorite for Gen Z shoppers (48%) and the least favorite for Baby Boomers (19%).
- SMS messages are the favorite for both Gen Z and Gen X at 26% and the least favorite for Baby Boomers at (17%).
- Influencer content is the favorite for Gen Z (24%) and the least favorite for Baby Boomers (4%).
Black Friday conversion statistics
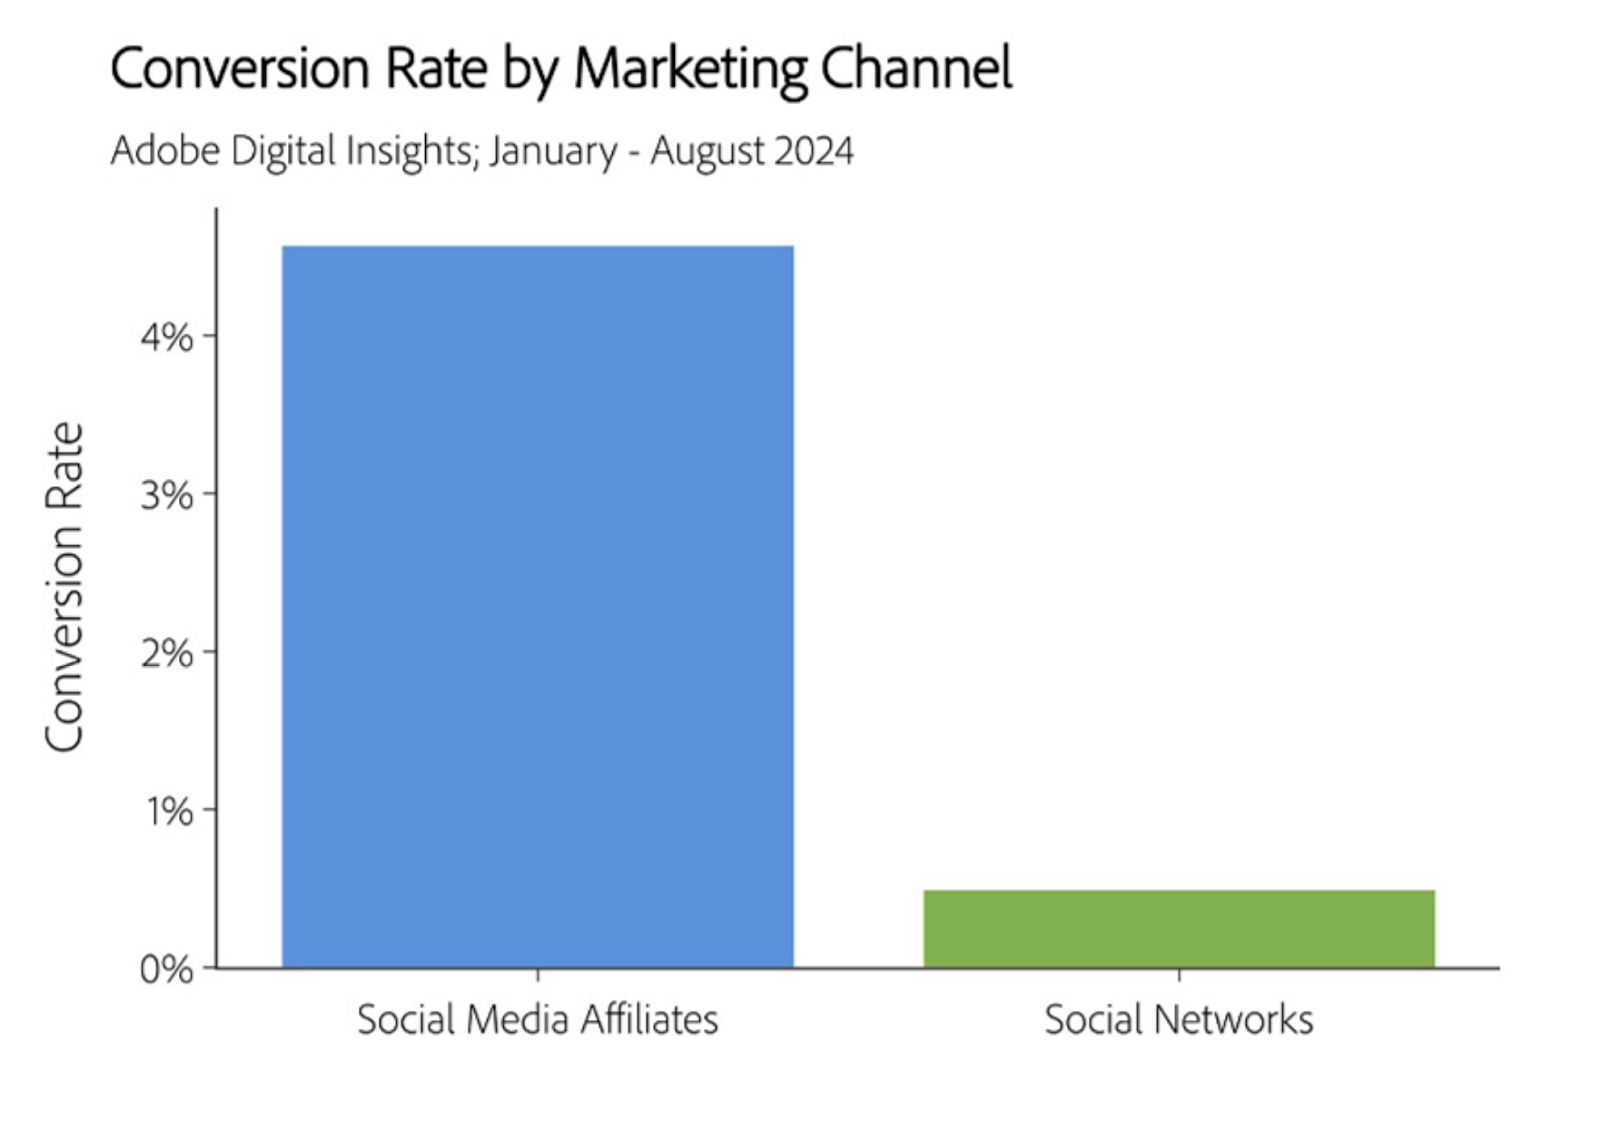
Social Media affiliates, social media influencers, and partners have a conversion rate 10x higher than social media marketing.
As Black Friday approaches, brands are expected to lean into this high conversion rate by leveraging influencer marketing,
As of 2024, 54% of Millennials have made a purchase directly from an email.
This is followed by 53% of Gen X, 52% of Gen Z, and 41% of Baby Boomers.
56% of Gen Z has made a purchase directly from a paid social ad.
This is followed by 51% of Millenials, 37% of Gen X, and 25% of Baby Boomers
49% of Gen Z has made a purchase directly from a push notification.
This is followed by 43% of Gen X, 38% of Millennials, and 31% of Baby Boomers.
Relative to reach, mobile app push notifications are 127% more likely to convert shoppers to buyers than paid ads.
They are also 124 % more likely to convert shoppers to buyers than emails and 21% more likely to convert than SMS.
As of 2024, Black Friday has a conversion rate of 6.5% for desktops.
Meanwhile, mobile has a conversion rate of 3.2%.
Check out Whop for ecommerce advice and education
Prepare your store for Black Friday by learning from seasoned ecommerce experts who have mastered the art of selling online. Whop is home to thousands of online courses, communities, and tools that can help your business to thrive.
